








Every maintenance argument eventually comes down to one number: how much of the time is the plant actually running? ‘Availability’ sounds vague until you put an equation under it — and that equation reveals a hard truth: how often you fail and how fast you recover matter in very different ways.
This article defines MTBF, MTTR and availability, shows how they combine, and explains why chasing reliability (fewer failures) and maintainability (faster repairs) are two distinct levers with different economics.
The three numbers
Mean time between failures (MTBF) measures reliability — the average running time between stoppages. Mean time to repair (MTTR) measures maintainability — the average time to get running again. Availability is the fraction of time the asset is up:
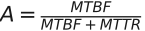
It is the running time divided by running plus repair time. Push MTBF up or MTTR down and availability rises — but, as the next section shows, not symmetrically.
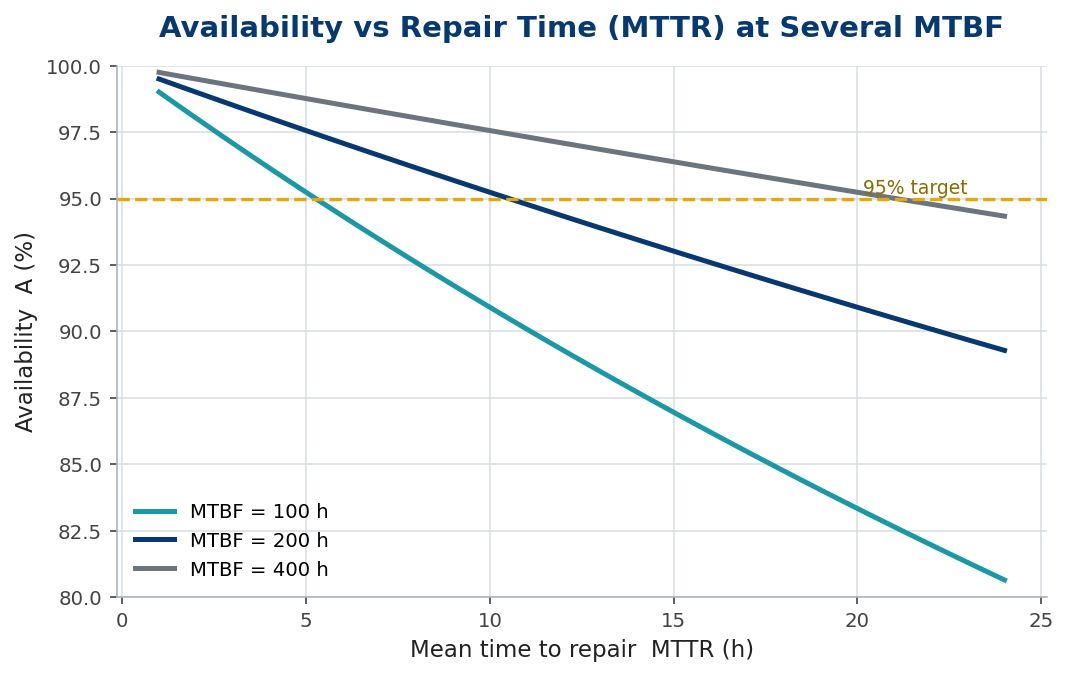
Worked example 1 — computing availability
A screen runs on average 200 hours between failures and takes 8 hours to repair:

Now halve the repair time to 4 hours:  . The same 1.8-point gain could come from raising MTBF from 200 to about 400 hours — twice the reliability for the same result. Which is cheaper depends on the machine.
Reliability versus maintainability
The two levers behave differently. When MTTR is already small next to MTBF, shaving it further yields little; the route to higher availability is fewer failures. But where repairs are long — a liner change, a bearing deep in a machine — MTTR dominates and faster recovery (better access, spares on the shelf, a drilled crew) pays best. The art is knowing which regime you are in before you spend.
Worked example 2 — the cost of a point
A plant rated at 300 t/h running 6,000 h/yr at a margin of Rs 60/t loses, for every point of availability,  . That single figure reframes the maintenance budget: if a Rs 15 lakh spares-and-access programme lifts availability two points, it returns more than ten times its cost. Availability is not a maintenance metric; it is a revenue one.
In practice
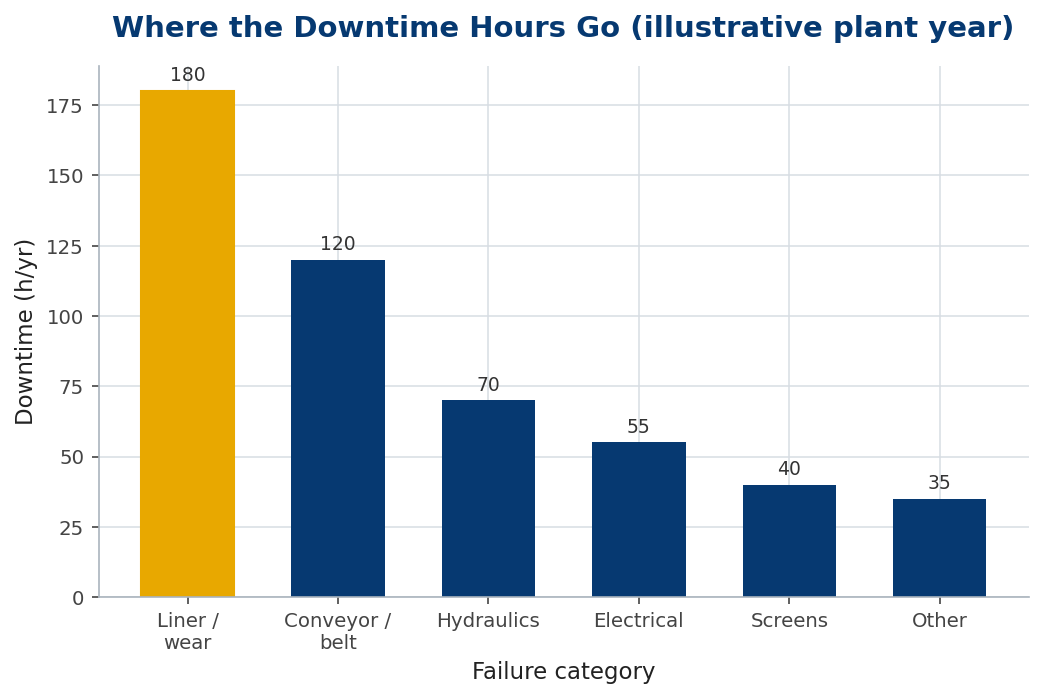
Measure the components, not just the headline: log every stoppage with its duration and cause so you can compute MTBF and MTTR per machine, then build the downtime Pareto. Attack the top one or two categories — they own most of the lost time — and decide for each whether the cheaper win is fewer failures or faster repairs. Keep critical spares on the shelf and design for access; a two-hour bearing change that needs no crane or cutting is worth more than another condition monitor.
Common mistakes
- Chasing MTBF when MTTR dominates. If repairs are long, better access and spares beat more reliability.
- Averaging across the plant. Compute MTBF/MTTR per machine; the Pareto hides inside the average.
- Ignoring the revenue value of a point. Price availability in lost margin and the maintenance budget rights itself.
From availability to OEE: the fuller picture
Availability tells you the plant was running, but not that it was running well. A crusher can be ‘available’ all shift yet produce below rate, or produce plenty of off-spec product that has to be recrushed. Overall equipment effectiveness (OEE) closes that gap by multiplying three fractions:

where  is availability (the uptime we have measured),
  is performance (actual rate divided by design rate) and
  is quality (the fraction of output that is good first time). A plant at 95% availability, 85% performance and 96% quality is running at
  , or 78% OEE — a very different, and more honest, number than the 95% the availability figure alone would advertise.
The value of decomposing it this way is that each factor points to a different team and a different fix. Low availability is a maintenance and reliability problem — the MTBF and MTTR levers of this article. Low performance is an operations problem — choke feeding, settings, bottlenecks starving the line. Low quality is a process-control problem — worn liners, drifting screens, recirculating off-spec. Chasing the wrong one wastes effort: buying reliability when the real loss is a starved crusher running at 80% of rate fixes nothing the customer sees.
So measure OEE, not just availability, and attack its smallest factor first. The discipline of splitting losses into availability, performance and quality keeps a plant honest about where its tonnes are really going — and very often the biggest, cheapest gain is in performance, hiding behind a comfortable availability number.
A worked reliability budget
Putting numbers to the two levers makes the choice concrete. Take a screen at MTBF 150 hours and MTTR 6 hours, giving availability  . Suppose two improvement projects cost the same. Project A — better sealing and condition monitoring — lifts MTBF to 250 hours, raising availability to
  . Project B — on-shelf spares and improved access — cuts MTTR to 3 hours, raising availability to
  . Here the maintainability project just edges it, because the repair time was a large enough fraction of the cycle that halving it paid more than two-thirds more reliability.
Flip the starting point — a machine that fails rarely but takes a full day to fix when it does — and the same arithmetic swings hard toward cutting MTTR, because the long repair dominates the downtime. The lesson is not that one lever always wins, but that the numbers decide and they are cheap to run. A few minutes with the availability formula, costed against each candidate project, turns a maintenance argument into an investment comparison — and routinely redirects spend from the intuitively appealing fix to the one that actually buys the most uptime per rupee.
The bottom line
Availability is  : reliability and maintainability combined. Raising MTBF and cutting MTTR both help, but the cheaper lever depends on which one dominates — so measure both per machine.
Log stoppages, build the Pareto, price a point of availability in lost margin, and spend where it returns most — and ‘uptime’ stops being a slogan and becomes a managed number.
Frequently asked questions
What is the difference between MTBF and MTTR?
MTBF is the average running time between failures (reliability); MTTR is the average time to repair and restore (maintainability).
How is availability calculated?
A = MTBF / (MTBF + MTTR) — running time divided by running plus repair time, expressed as a fraction or percentage.
Should I improve reliability or repair time first?
Whichever dominates. If repairs are short relative to run time, cut failures; if repairs are long, improve access and spares to cut MTTR.
Key takeaways
 combines reliability and maintainability.
- Raising MTBF and cutting MTTR both help — the cheaper lever depends on which dominates.
- Build a downtime Pareto and attack the few categories that own most lost time.
- Price a point of availability in lost margin to size the maintenance spend.
