
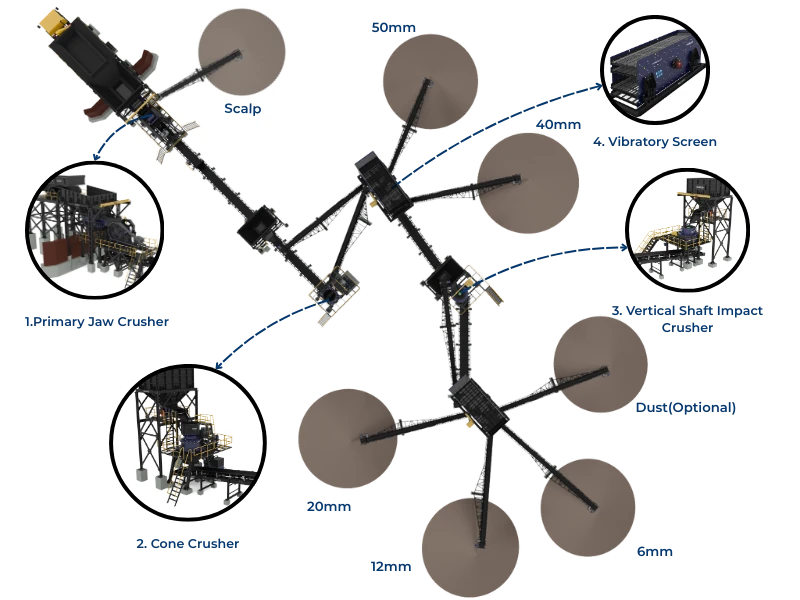
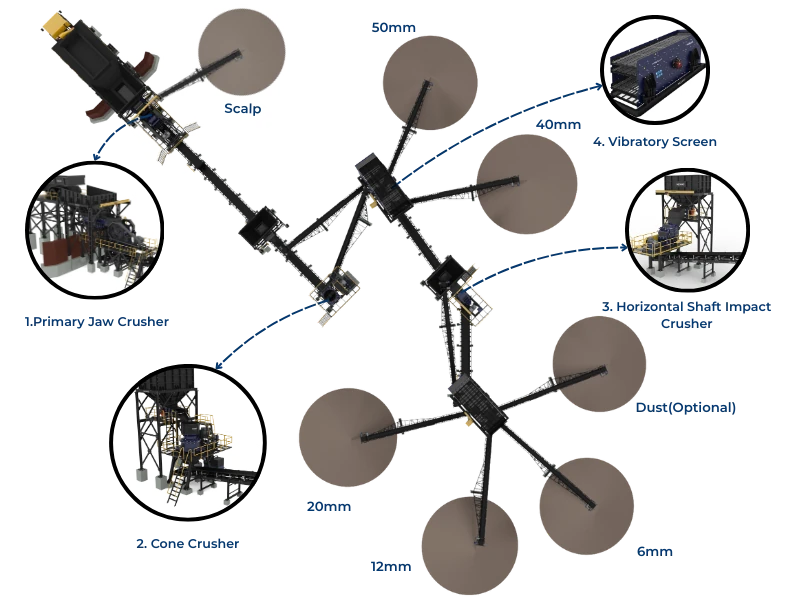
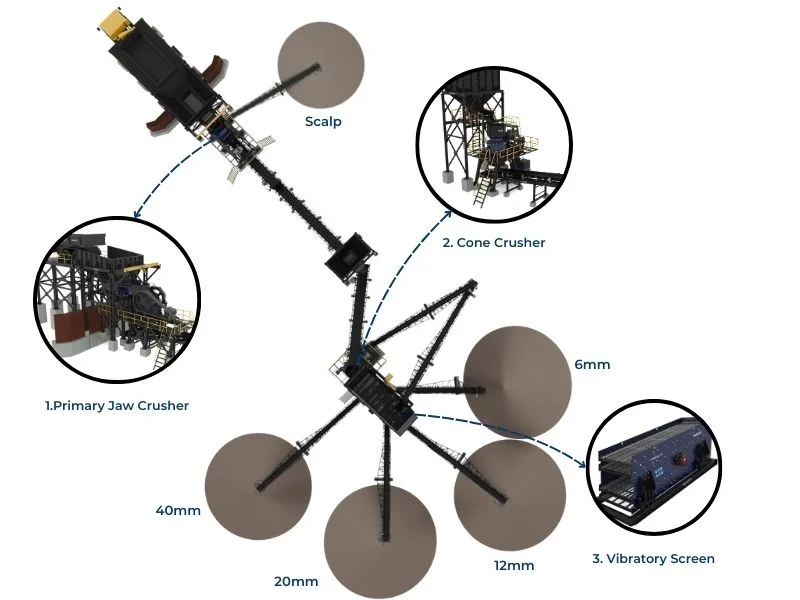
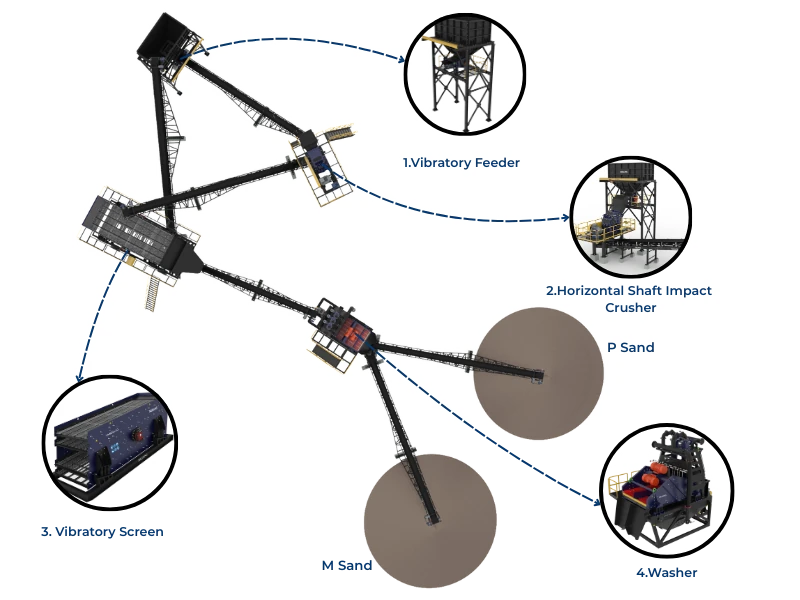





Before you change a crusher setting, add a screen or buy a second cone, it would be useful to know what the change will do — without disrupting production to find out. That is what comminution simulation offers: a mathematical model of the crushing and screening circuit that predicts product size and throughput from the feed and the equipment, so you can test changes on a screen instead of on the plant.
This article introduces the building blocks of circuit simulation — the breakage and classification models — explains why a model must be calibrated to your plant, and shows how a validated model is used to answer real questions.
What a circuit model is made of
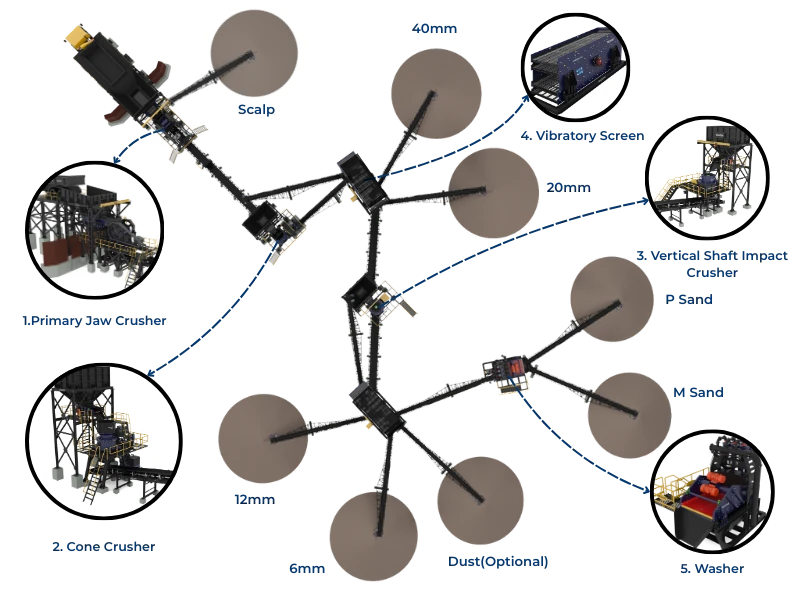
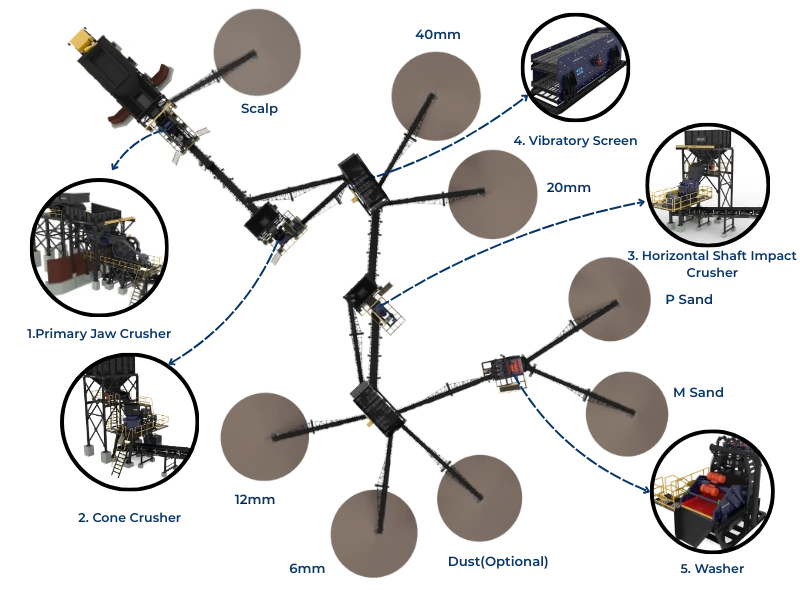
A comminution model represents each unit by how it transforms a size distribution. A crusher is described by a breakage function (how a particle, once broken, distributes into smaller sizes) and a selection function (the chance a particle is broken at all, set by the machine and its setting). A screen is described by a partition (efficiency) curve — the same Tromp curve used for cyclones. Chain these unit models, close the recycle loops, and solve for the steady-state size distributions around the circuit.
Worked example 1 — the question a model answers
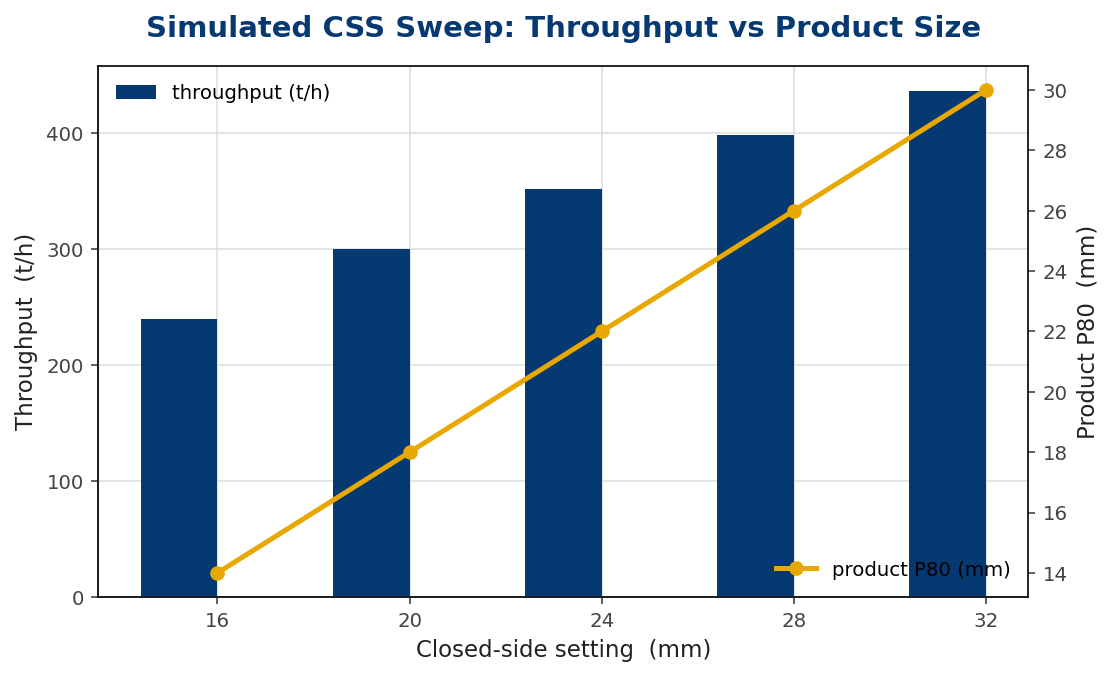
Suppose you want to know whether opening the secondary cone from 20 to 24 mm will overload the closing screen. The simulation says throughput rises from 300 to 352 t/h but the product P80 coarsens from 18 to 22 mm, which pushes more oversize back to the screen and lifts the circulating load. You learn, on a laptop, that the change gains tonnes but needs screen capacity to absorb the extra recycle — before touching the plant. That is the value: cheap, fast, non-disruptive what-ifs.
A model is only as good as its calibration
The breakage and selection functions are not universal — they depend on the rock and the specific machine. A model taken from a textbook will be roughly right and precisely wrong. The discipline is calibration: run a survey of the real circuit (sample every stream, sieve everything, balance the masses), then fit the model parameters until it reproduces that survey. Only then can it be trusted to extrapolate.
Worked example 2 — the survey that makes it real
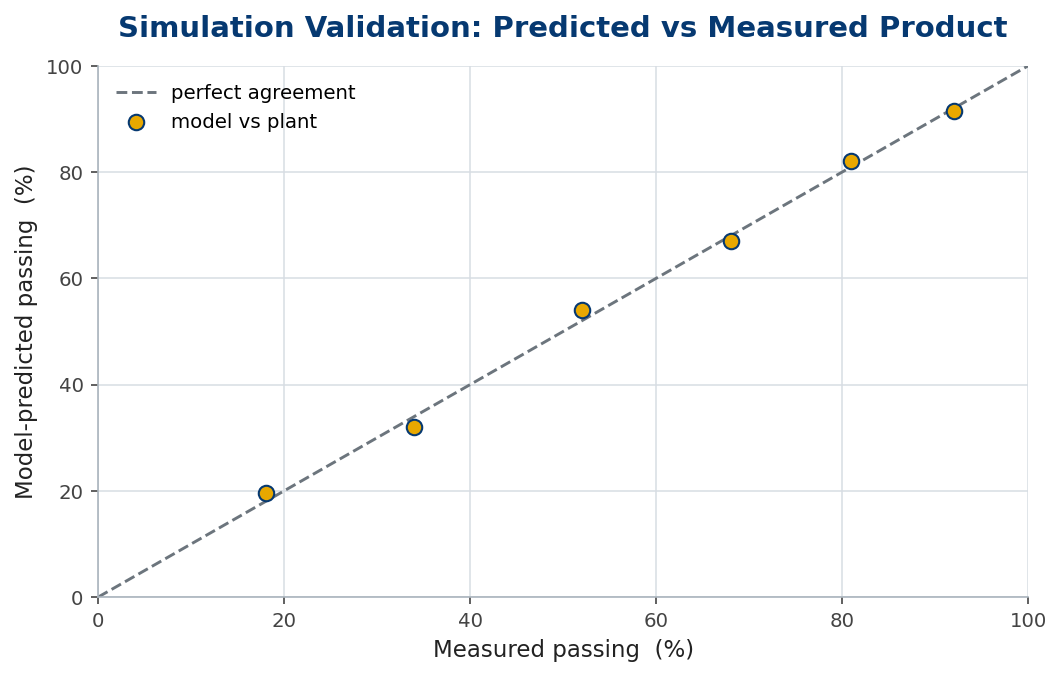
An engineer wants to simulate a plant but the first run disagrees badly with reality. The cause is almost always the survey, not the maths: a stream sampled while the plant was not at steady state, or a mass balance that does not close because a flow was missed. Re-surveying carefully — steady state, every stream, masses reconciled — and re-fitting brings the parity plot onto the diagonal. The lesson every modeller learns: the simulation is easy; the data is the work. A model calibrated to a clean survey is a reliable guide; one fitted to a sloppy survey is a confident liar.
| Model element | Represents | Where it comes from |
|---|---|---|
| Breakage function | how particles split | drop-weight / lab test, fitted |
| Selection function | what gets broken | machine + setting, calibrated |
| Partition curve | screen / cyclone split | survey of the unit |
| Mass balance | flows around loops | reconciled plant survey |
In practice
Treat simulation as decision support, not a crystal ball: use a calibrated model to rank options and find the surprises, then confirm the chosen change on the plant. Invest in the survey — the model lives or dies on the quality of the data it is fitted to, so sample at steady state, sieve thoroughly and reconcile the mass balance before fitting. Validate before you trust: a parity plot against held-back data is the honest test. And keep the model current; as liners wear and feed changes, recalibrate so it keeps matching the plant it is meant to represent.
Common mistakes
- Using textbook parameters. Breakage and selection depend on your rock and machine — calibrate to a real survey.
- Trusting an unvalidated model. Check predictions against held-back data on a parity plot first.
- Blaming the maths for bad data. Most disagreement is a non-steady-state or unbalanced survey, not the model.
Steady-state, dynamic and particle-scale models
The models in this article are steady-state: they solve for the average size distributions when the circuit has settled, which is exactly what you want for sizing equipment and comparing flowsheet options. But a plant is not always at steady state, and two other model families answer questions the steady-state picture cannot.
Dynamic models add time. They predict how the circuit responds to a disturbance — a feed surge, a stockpile running out, a crusher tripping — and how bins, recycles and control loops behave as it propagates. Where the question is about stability, surge-bin sizing or control design rather than steady output, a dynamic model earns its extra complexity; a steady-state model is silent on transients by construction.
Discrete element method (DEM) models go the other way, down to the particle scale. Instead of size distributions, DEM simulates individual particles colliding inside a chamber or on a screen, computing the forces and breakage from first principles. It is computationally heavy and reserved for equipment design — understanding flow in a crusher chamber, wear on a liner, motion on a screen deck — rather than whole-circuit balances, but it reveals mechanisms the population-balance models simply assume.
The practical guidance is to match the model to the question. Use a calibrated steady-state model for the everyday work of sizing, setting and flowsheet what-ifs; reach for a dynamic model when transients, buffering or control are the issue; and leave DEM to specialist equipment design. Reaching for the heaviest tool by default wastes effort — most plant questions are answered by the steady-state model this article describes, well calibrated to a clean survey.
The bottom line
Comminution simulation chains breakage, selection and partition models to predict a circuit’s product and throughput — letting you test changes off-plant. But a model is only as good as the plant survey it is calibrated and validated against.
Build the model on a clean, steady-state, mass-balanced survey, validate it on a parity plot, and use it to rank options and surface surprises before committing — cheap what-ifs that save expensive plant experiments.
Frequently asked questions
What does a comminution simulation predict?
The size distributions and flows around a crushing/screening circuit — product size and throughput — from the feed, the equipment models and the circuit connections.
Why must a model be calibrated?
Breakage and selection functions depend on the specific rock and machine. A model must be fitted to a real plant survey before it can be trusted to extrapolate.
Why does my simulation disagree with the plant?
Usually the survey: data taken off steady state or a mass balance that doesn't close. Re-survey carefully and re-fit before doubting the model.
Key takeaways
- Circuit models chain breakage, selection and partition (screen) functions.
- They let you test setting, screen and equipment changes off-plant — cheap what-ifs.
- A model must be calibrated to a clean, steady-state, mass-balanced plant survey.
- Validate on a parity plot; most disagreement is bad data, not bad maths.
