









Ask why one concrete is workable and strong while another of the same materials is harsh and thirsty, and the answer is usually the gradation. There is a particular distribution of sizes that packs to maximum density — minimum voids — and the 0.45 power curve is the elegant way to draw it as a straight line and design a blend toward it.
This article sets out the maximum-density relation, plots a blend against it on the 0.45 power chart, and connects deviation from the line to the voids that drive binder demand and strength.
The maximum-density relation
Fuller and Thompson found that aggregate packs most densely when the percentage passing each sieve follows a power law of size:
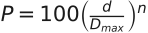
with  the percent passing size
  ,
,  the maximum size, and an exponent
  near 0.45 for angular crushed aggregate. The trick: plot the size axis raised to the 0.45 power, and this curve becomes a straight line from the origin to 100% at .
Worked example 1 — the target at a sieve
For  , the maximum-density target passing the 4.75 mm sieve is

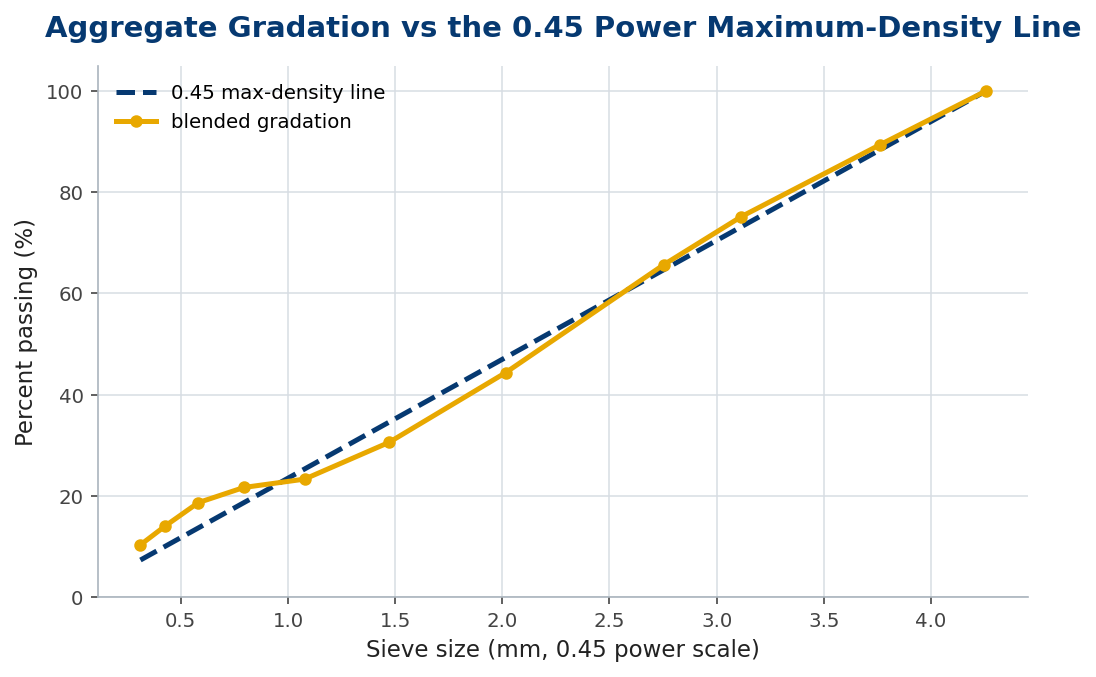
Repeat across the sieve set and you have a target gradation to blend toward — the straight line in Figure 1.
Why the line matters
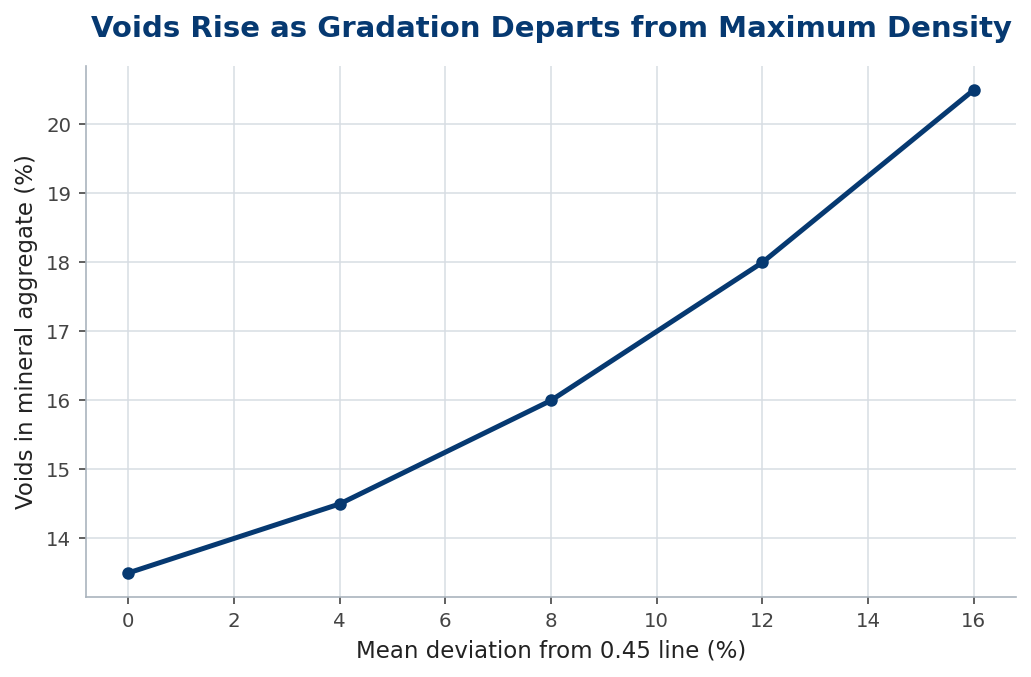
Following the line minimises the voids between particles, and voids are what a binder must fill. Depart from it — too much of one size, a gap in the middle — and the voids rise, taking cement paste or bitumen and water demand up with them.
The restricted zone and gap grading
The line is a guide, not a law. Practical specs keep the gradation close to it but allow it to weave a little, and some deliberately avoid the line through the sand sizes — the historical ‘restricted zone’ — to prevent a tender, over-sanded mix. The point is not to trace the line slavishly but to use it as the reference from which sensible, controlled departures are made.
| Gradation | Voids | Behaviour |
|---|---|---|
| On the 0.45 line | lowest | dense, economical |
| Gap graded | higher | harsh, segregation risk |
| Over-sanded | higher | tender, high water demand |
Worked example 2 — designing a blend
Two stockpiles — a 20 mm coarse and a crusher sand — are blended to hit the line. If the coarse alone sits above the line in the fines and the sand sits below, a blend of, say, 60% coarse to 40% sand pulls the combined curve onto the target. You compute the combined percent passing at each sieve as the mass-weighted average and adjust the ratio until the curve hugs the line. The 0.45 chart turns a blending guess into a one-variable optimisation.
In practice
Plot every mix design and every production gradation on the 0.45 chart — it reveals at a glance what a table of numbers hides: a humped curve that will segregate, a gap that will need extra paste, a tail of fines that will spike water demand. Control the blend ratio at the plant to hold the curve as feed stockpiles drift. And match the exponent to the material: 0.45 suits dense-graded angular aggregate, but open-graded or specialty mixes use other targets — the chart is a tool, not a single recipe.
Common mistakes
- Reading gradation as a table. Plot it on the 0.45 chart to see humps, gaps and fines tails.
- Tracing the line slavishly. Controlled departures (e.g. avoiding an over-sanded zone) are deliberate; the line is a reference.
- Letting the blend drift. Hold the ratio as stockpiles change to keep the curve on target.
Coarseness and workability: reading the blend two ways
The 0.45 chart shows whether a blend follows the maximum-density line, but it does not by itself tell you how the mix will behave — whether it will be harsh, sandy, sticky or workable. For that, mix designers add the coarseness factor and workability factor (the Shilstone approach), two numbers computed from the combined gradation that classify the blend’s behaviour at a glance.
The coarseness factor compares the coarse aggregate to the intermediate, distinguishing a rocky, gap-prone blend from a sandy one; the workability factor tracks the proportion passing the finer sieves, indicating how the mix will place and finish. Plotted against each other, a blend falls into a zone — well-graded, gap-graded, rocky, or sandy — that predicts its behaviour more directly than the gradation curve alone.
The two views are complementary. The 0.45 line answers ‘is this blend dense and economical?’; the coarseness-workability chart answers ‘will it be pleasant to place and finish?’. A blend can hug the maximum-density line yet sit in a harsh, segregation-prone zone, or vice versa, so reading both keeps the designer from optimising density at the expense of workability or the reverse.
For a producer, the value is in steering the stockpile proportions toward a blend that satisfies both — dense enough for economy, workable enough for placement. The combined gradation is the input to all of it, which is why controlling the blend ratio at the plant matters: hold the gradation steady and both the density line and the workability zone stay where you designed them, batch after batch.
The bottom line
The 0.45 power curve,  , draws the maximum-density gradation as a straight line and turns blending into an optimisation against it. Following it minimises voids; departing from it costs binder and water.
Plot every gradation on the chart, blend to hug the line with deliberate exceptions, and you design dense, economical, workable mixes by sight as well as by number.
Frequently asked questions
Why 0.45 and not 0.5?
Fuller's original work used ~0.5; Superpave adopted 0.45 because it better represents the packing of angular crushed aggregate. Match the exponent to the material.
Does the line guarantee the best mix?
It gives maximum density (minimum voids), which is usually desirable, but specific mixes deliberately depart from it — use it as a reference, not a mandate.
How do I design a blend with it?
Compute the combined percent passing as the mass-weighted average of your stockpiles and adjust the ratio until the curve hugs the 0.45 line.
Key takeaways
- is the maximum-density gradation — a straight line on the 0.45 axis.
- Following it minimises voids; departing from it raises binder and water demand.
- Plot every gradation on the chart to see humps, gaps and fines tails.
- Blend by mass-weighted averaging; allow deliberate, controlled departures.
