








Screen efficiency is the number that ties together product quality, circulating load and plant throughput — yet it is rarely measured, because operators assume it cannot be without stopping the plant. It can: three sieve analyses, of the screen feed, the oversize and the undersize, are enough to calculate it from a mass balance.
This article derives the efficiency from that balance, works an example from real sieve numbers, and connects the result to the partition curve that describes how sharply a screen actually cuts.
What efficiency means
Screen (undersize-recovery) efficiency is the fraction of the fine material in the feed that actually reports to the undersize product. The fines that escape into the oversize are the loss. From a mass balance on the minus-aperture material:
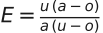
where  ,
,  and
and  are the fractions finer than the aperture in the feed, the oversize and the undersize streams. When the undersize is essentially all fines (
 ) this simplifies to
  .
.
| Symbol | Meaning | Units |
|---|---|---|
| a | Fraction finer than aperture in feed | – |
| o | Fraction finer than aperture in oversize | – |
| u | Fraction finer than aperture in undersize | – |
| E | Undersize-recovery efficiency | – |
: the fines stranded in the oversize. A screen with no fines in its oversize ( ) and clean undersize is 100% efficient; everything below that is misplaced material.
Worked example 1
Sieve analyses at the aperture give feed  , oversize
  , undersize
  :
:

The screen recovers 89% of the available fines — the other 11% leave in the oversize and, in a closed circuit, become circulating load.
Where the efficiency goes
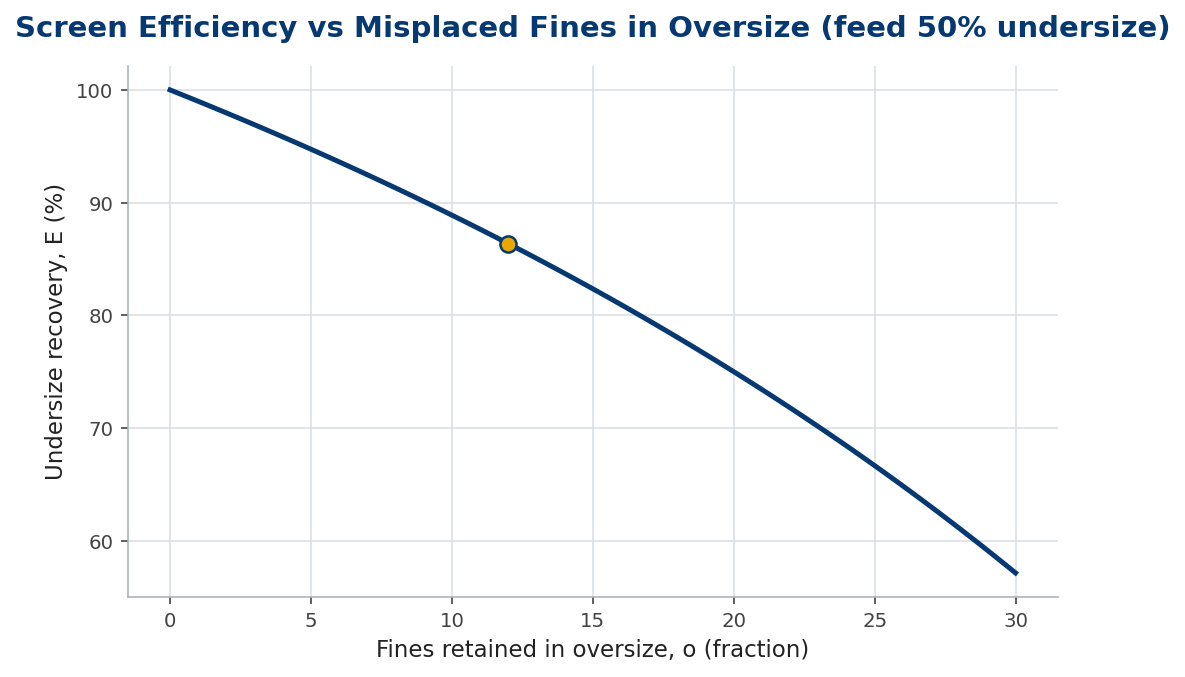
Efficiency falls as more fines are stranded in the oversize — from a deep bed, a blinded cloth, too little g-force or simply too much feed. Figure 1 holds the feed at 50% fines and shows efficiency dropping as the misplaced-fines fraction climbs.
The partition curve
A single efficiency number hides how the screen cuts. The partition (Tromp) curve plots the chance a particle of a given size reports to the oversize. An ideal screen would be a step at the aperture; a real one is an S-curve, and the size at which a particle has a 50:50 chance — the  — is the effective cut. The sharper (steeper) the curve, the more efficient the screen.
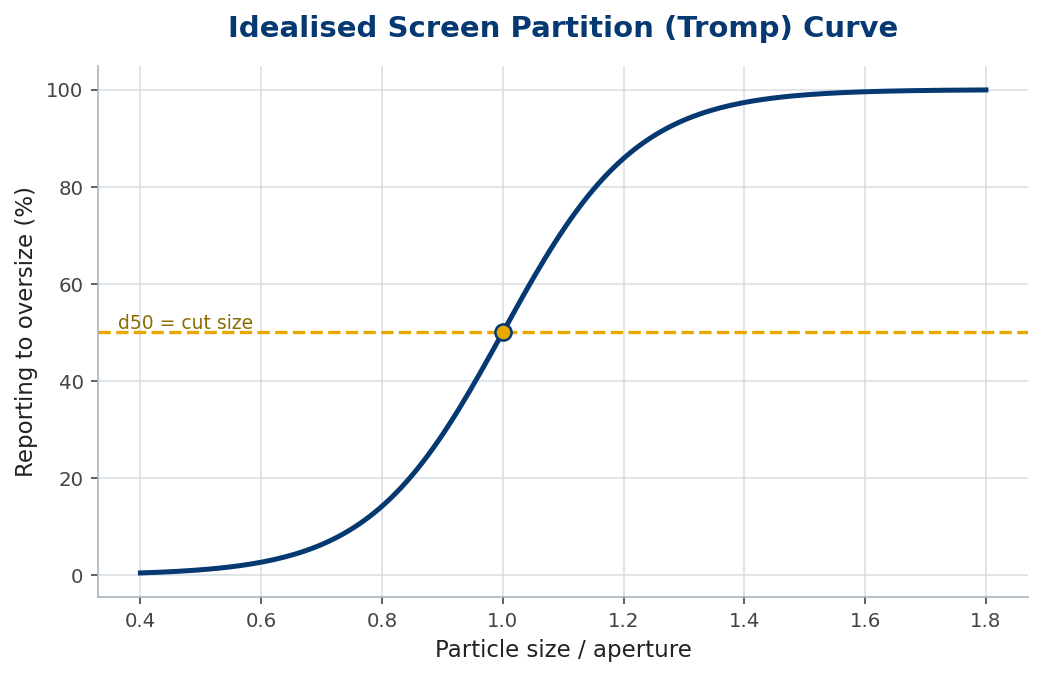 ; a steeper curve means a sharper separation and fewer misplaced particles.
Worked example 2 — the throughput link
The same screen at 89% efficiency, fed with material 50% finer than the aperture, drives a circulating load of  in closed circuit — 125% of fresh feed recirculating. Lift efficiency to 95% and
  falls to 1.10; let it slip to 80% and climbs to 1.50. Measuring efficiency is therefore measuring spare capacity, not just product quality.
In practice
Cutting three representative samples is the hardest part: take full-width increments of feed, oversize and undersize at the same moment, and split them down carefully before sieving. Sieve at the aperture of interest and read the percent passing for each stream. Do this once a quarter and at every complaint, and you build a history that tells you when a cloth is blinding or a deck is overloaded — long before the product sheet does.
Common mistakes
- Sampling one stream. Efficiency needs feed, oversize and undersize together, at the same time.
- Confusing efficiency with the cut. The is where it cuts; efficiency is how cleanly — read the partition curve for both.
- Treating it as quality-only. Falling efficiency is also rising circulating load and lost throughput.
Near-size material: why efficiency collapses at the cut
A screen separates cleanly far from its aperture and struggles right at it, and the reason is near-size material — particles close to the aperture size. A particle much smaller than the opening falls through on first presentation; a particle much larger never could; but a particle near the aperture only passes if it arrives nearly square-on to an open hole, a matter of probability that needs many presentations to resolve.
This is why the partition curve is S-shaped rather than a clean step, and why screening efficiency is dominated by the near-size fraction in the feed. A feed rich in particles near the cut is inherently hard to screen sharply, however good the machine: there is simply a lot of material that needs many chances to make up its mind which side to go. The same screen on a feed with little near-size material separates beautifully.
The defences all amount to giving near-size particles more chances. A longer deck, a thinner bed, the right stroke to stratify the fines down to the surface, and — crucially — enough deck length for many presentations all help. So does keeping the apertures open: a blinded or pegged screen, its near-size holes plugged, loses efficiency exactly where it was already weakest.
The practical reading is to judge a screening duty by its near-size content, not just its tonnage. A high near-size feed needs more deck area and a sharper machine for the same efficiency, and a target efficiency that ignores the feed’s near-size fraction is a number set in a vacuum. Efficiency is made or lost in the narrow band of sizes either side of the cut — design the screen for that band.
The bottom line
Screen efficiency is measurable from three sieve analyses and a mass balance,  , and the loss is exactly the fines stranded in the oversize. Read alongside the partition curve, it tells you both where the screen cuts and how sharply.
Because efficiency sets circulating load, measuring it is measuring throughput. A quarterly three-stream sieve is one of the cheapest diagnostics a plant can run.
Frequently asked questions
Do I have to stop the plant to measure efficiency?
No — take simultaneous increment samples of feed, oversize and undersize while running, then sieve them. The calculation does the rest.
What is a good screen efficiency?
Well-run sizing screens reach 90–95% undersize recovery. Below ~85% usually means a deep bed, blinding, or too little g-force.
Efficiency or d50 — which matters?
Both. The is the effective cut size; efficiency (and the partition curve's steepness) is how cleanly the screen achieves it.
Key takeaways
- from feed, oversize and undersize sieve analyses.
- The loss is the fines stranded in the oversize — minimise .
- The partition curve shows the cut () and the sharpness; efficiency is one number from it.
- Efficiency sets circulating load, so measuring it is measuring throughput.
