






Aggregate is a low-carbon material by the standards of construction — a tonne of crushed stone carries a tiny fraction of the emissions of a tonne of cement or steel. But ‘low’ is not ‘none’, and as carbon reporting reaches the quarry, a producer needs to know where the kilograms of CO come from and which levers actually move them.
This article builds the footprint of a tonne of aggregate from its sources, shows that diesel haulage and grid electricity dominate, and quantifies how decarbonising the grid shrinks the crushing share.
The footprint equation
The carbon footprint is each energy input multiplied by its emission factor, summed across the process:
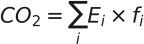
where  is the energy (or fuel) used by step
  per tonne and
  its emission factor — about 0.7–0.8 kg CO per grid kWh and roughly 2.7 kg per litre of diesel.
Where the carbon is
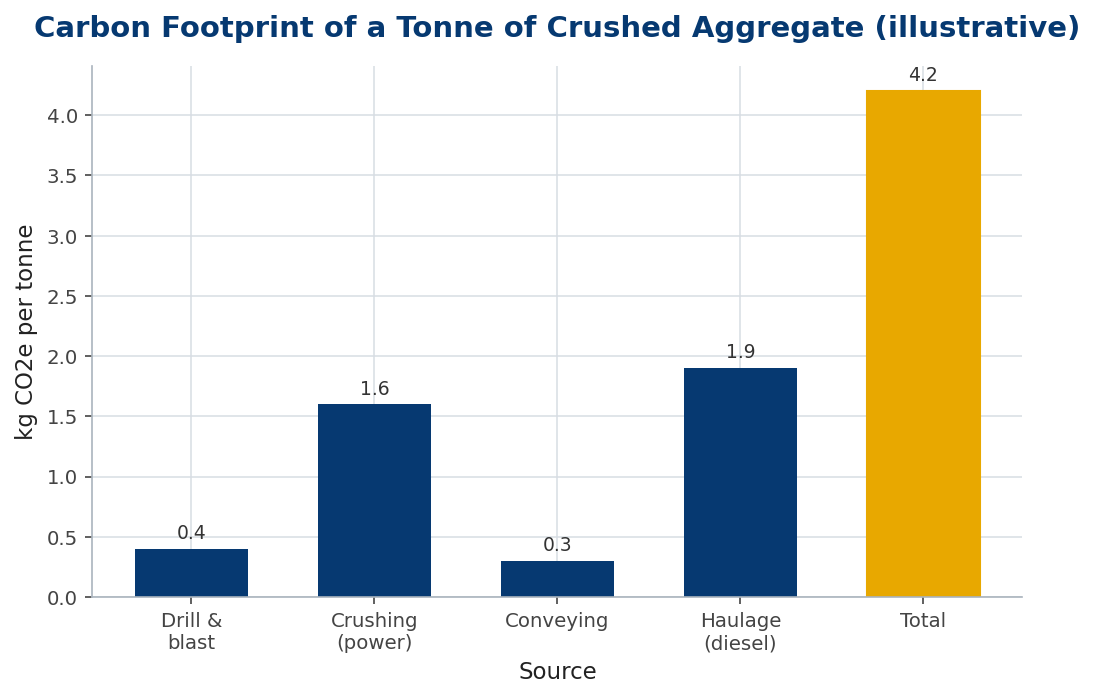
Add the sources for a typical electrically-crushed, truck-hauled operation and two of them dominate: the diesel burned moving rock, and the grid electricity that crushes it. Drilling, blasting and conveying are minor by comparison.
Worked example 1
Crushing at a specific energy of 2 kWh/t on a grid at 0.8 kg CO/kWh emits

Add ~1.9 kg/t for haulage, plus small contributions from blasting and conveying, and the total lands near 4.2 kg CO per tonne — the stack in Figure 1.
The grid is the big lever on crushing
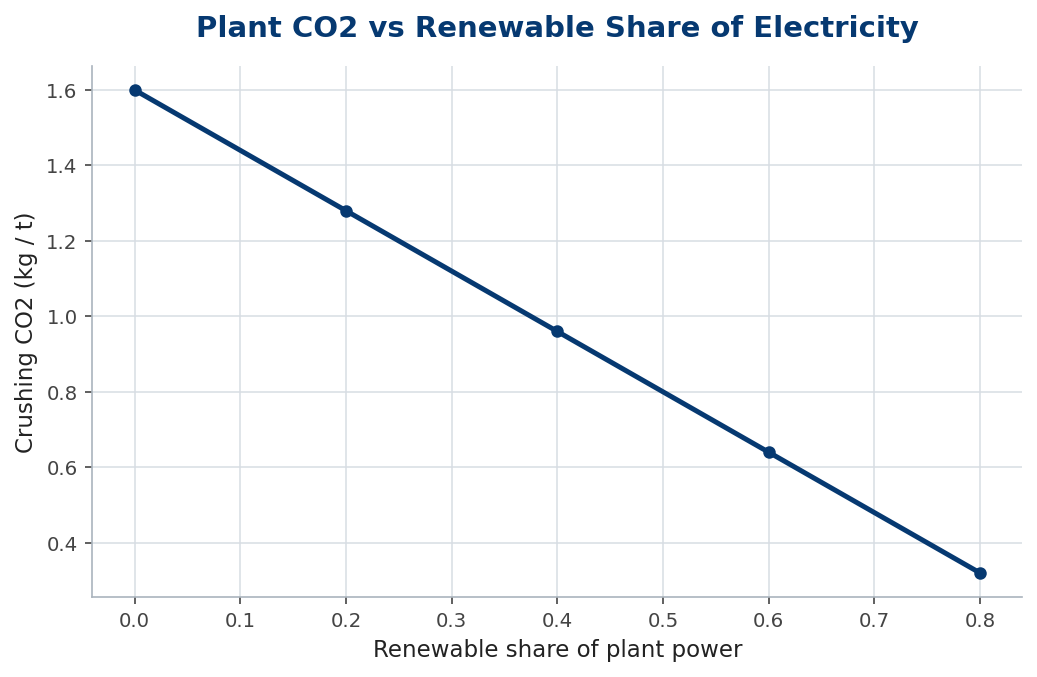
Because crushing emissions are grid electricity times specific energy, they fall in direct proportion to how clean the electricity is. A plant that sources half its power from renewables halves its crushing carbon; one that reaches a fully renewable supply removes the crushing bar almost entirely.
Worked example 2 — the haulage lever
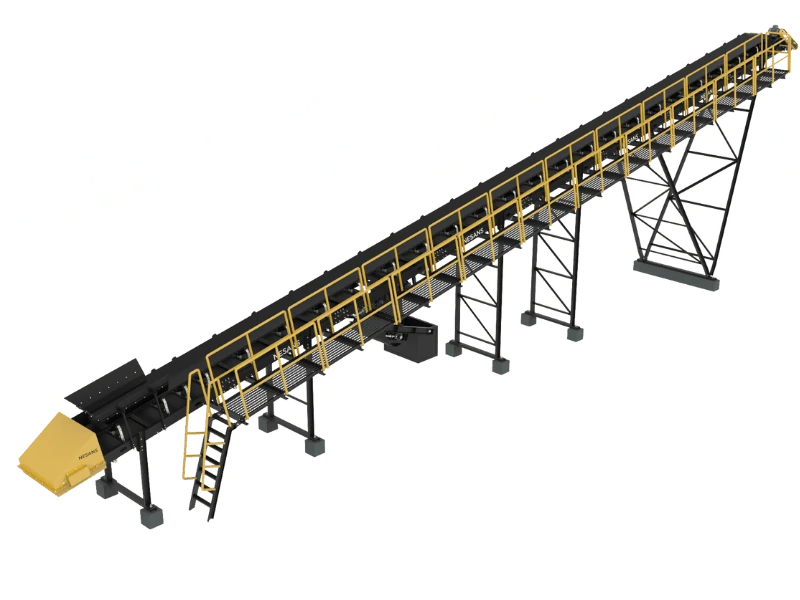
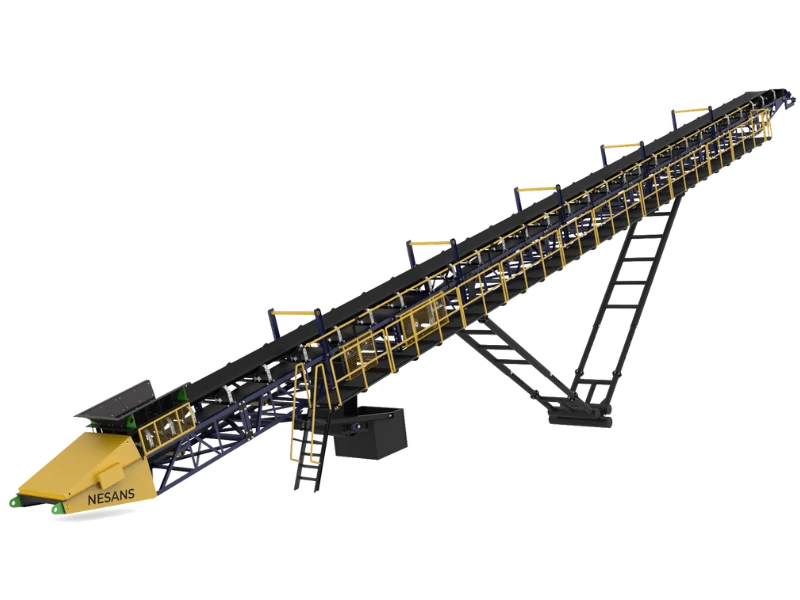
Haulage is the other dominant bar, and its lever is distance and mode. Replacing a 3 km in-pit truck haul with an overland conveyor can cut that ~1.9 kg/t to a few tenths, because an electric conveyor on a clean grid carries rock at a fraction of the energy — and the carbon — of a diesel truck. Between greening the grid and electrifying the haul, a 4.2 kg/t operation can realistically approach 1 kg/t without touching the rock itself.
| Lever | Targets | Effect |
|---|---|---|
| Renewable power | crushing, conveying | scales crushing CO2 to zero |
| Conveyor vs truck | haulage | large cut on the diesel bar |
| Energy efficiency | crushing kWh/t | smaller, still useful |
| Utilisation | all fixed energy | lowers CO2/t with cost/t |
In practice
Measure before you claim: meter the plant and log diesel so the footprint is built from real , not textbook defaults. Attack the two big bars — power source and haulage — before fussing over the small ones, and notice that the carbon levers and the cost levers point the same way: electrifying haul, greening power and running at high utilisation cut rupees and kilograms together. The carbon case for aggregate is rarely a sacrifice; it is usually the efficiency case wearing a different label.
Common mistakes
- Using default factors. Build the footprint from metered energy and logged diesel, not textbook numbers.
- Polishing the small bars. Blasting and conveying are minor; attack haulage and power.
- Treating carbon as separate from cost. The big carbon levers are the big cost levers — pursue them together.
Embodied carbon, EPDs and the procurement driver
The footprint maths matters now because customers are starting to ask for it. As construction tackles its embodied carbon — the emissions locked into materials before a structure is even used — the carbon content of aggregate is becoming a procurement criterion, not just an internal metric. A producer who can declare and lower it gains access to projects that specify low-carbon materials.
The vehicle for the declaration is the Environmental Product Declaration (EPD): a standardised, independently verified statement of a product’s environmental impacts over a defined boundary — for aggregate, typically cradle-to-gate, from extraction to the plant gate. An EPD turns the  calculation into a comparable, credible number that a specifier can put into a building’s carbon assessment, which is exactly why metering real energy and logging real diesel matters: the EPD is only as honest as its data.
The boundary is where rigour is won or lost. Cradle-to-gate counts extraction, processing and on-site handling; adding delivery (cradle-to-site) brings in the haulage that often dominates, and the choice of boundary can make two products look more alike or more different than they are. Comparing EPDs only makes sense within the same boundary — a discipline buyers are learning alongside producers.
So treat the carbon footprint as a market asset, not just a compliance number. Meter the plant, log the diesel, and build an EPD on a clear cradle-to-gate boundary, then attack the dominant sources — power and haulage — to lower the declared figure. The low-carbon aggregate is increasingly the saleable one, and the footprint equation is the first step toward a declaration a customer will pay attention to.
The bottom line
The footprint of a tonne of aggregate is , and it is dominated by diesel haulage and grid-powered crushing. Greening the electricity scales crushing carbon toward zero; electrifying the haul cuts the other big bar.
Measure from real energy use, attack the two dominant sources, and recognise that the carbon and cost cases align — the lowest-carbon aggregate plant is usually the cheapest-running one too.
Frequently asked questions
How much CO2 is in a tonne of aggregate?
Typically a few kilograms — on the order of 3–6 kg CO2e per tonne for an electrically-crushed, truck-hauled operation, far below cement or steel.
What is the single biggest lever?
The two big bars are haulage diesel and grid electricity. Greening the power and electrifying the haul move the footprint most.
Does cutting carbon cost money?
Usually not, on balance — the major carbon levers (renewables, conveyors over trucks, high utilisation) also lower cost per tonne.
Key takeaways
 ; ~0.7–0.8 kg/kWh grid, ~2.7 kg/litre diesel.
- Diesel haulage and grid crushing dominate; the rest is minor.
- Greening the grid scales crushing carbon toward zero; conveyors cut the haulage bar.
- Carbon levers and cost levers align — pursue efficiency and they fall together.
