Water balance calculation determines sand washing plant sustainability—matching water supply to process demands while maximizing recirculation. Plants that achieve 85-90% water recirculation consume 0.3-0.5 m³ fresh water per tonne processed versus 2-3 m³ for once-through systems. This guide provides calculation methods for designing and operating water-efficient sand washing operations.
Water Balance Components
Water Inputs
| Source | Typical Rate | Notes |
|---|
| Fresh water makeup | 0.3-2.0 m³/t | Depends on recirculation rate |
| Moisture in feed | 0.02-0.10 m³/t | 2-10% feed moisture |
| Recirculated water | 1.5-3.0 m³/t | From thickener overflow |
Water Outputs
| Destination | Typical Rate | Control Method |
|---|
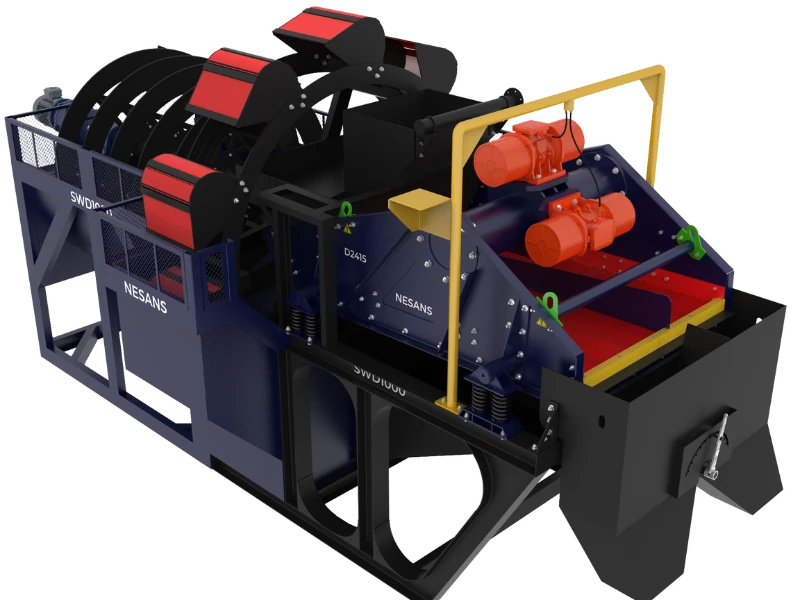
| Product moisture | 0.10-0.15 m³/t | Dewatering screen efficiency |
| Waste slurry | 0.05-0.15 m³/t | Thickener underflow density |
| Evaporation | 0.02-0.08 m³/t | Climate dependent |
| System losses | 0.01-0.05 m³/t | Leaks, spillage |
Water Balance Calculation
System Balance:
Fresh Water = Product Moisture + Waste Moisture + Evaporation + Losses - Feed Moisture

Example (200 TPH plant):
Product moisture: 0.12 m³/t × 200 t/hr = 24 m³/hr
Waste moisture: 0.10 m³/t × 200 t/hr = 20 m³/hr
Evaporation: 0.03 m³/t × 200 t/hr = 6 m³/hr
Losses: 0.02 m³/t × 200 t/hr = 4 m³/hr
Feed moisture: 0.05 m³/t × 200 t/hr = 10 m³/hr

Fresh water required: 24 + 20 + 6 + 4 - 10 = 44 m³/hr
Per tonne: 0.22 m³/t
Recirculation System Design
Key Components
| Component | Function | Sizing Parameter |
|---|
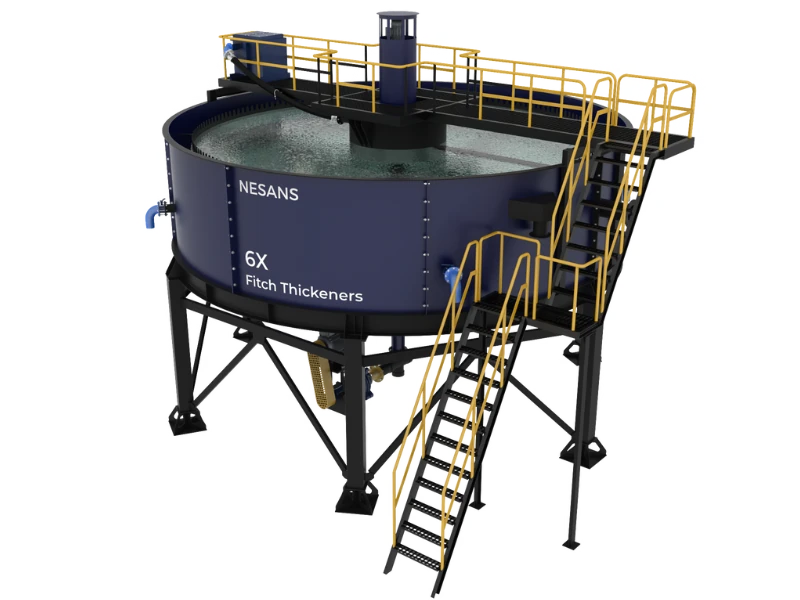
| Settling pond/thickener | Solids removal | Retention time: 2-4 hours |
| Clarified water tank | Buffer storage | 15-30 min process demand |
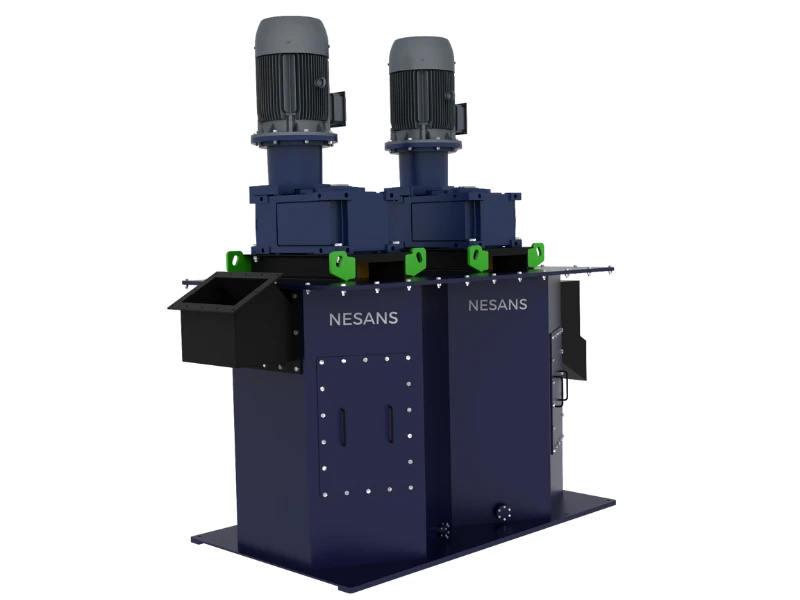
| Return pump | Recirculation | 1.2× peak demand |
| Flocculant system | Settling enhancement | 20-80 g/t solids |
Thickener Sizing
Required Area = (Feed Rate × Solids Content) / Unit Area Rate

For fine sand washing:
- Unit area rate: 0.3-0.5 t/m²/hr
- Feed solids: 5-15%

Example:
200 TPH × 10% solids = 20 t/hr solids
Area = 20 / 0.4 = 50 m² minimum
Diameter = √(50 × 4/π) = 8m thickener
Optimization Strategies
Reduce Fresh Water Consumption
| Strategy | Fresh Water Reduction | Implementation |
|---|
| Improve thickener efficiency | 10-20% | Optimize flocculant, bed management |
| Better dewatering | 5-10% | Upgrade dewatering screen |
| Reduce spillage | 2-5% | Maintenance, containment |
| Covered tanks | 3-8% | Reduce evaporation |
Monitoring Parameters
| Parameter | Target | Measurement | Frequency |
|---|
| Fresh water rate | <0.5 m³/t | Flow meter | Continuous |
| Recirculation rate | >85% | Calculated | Daily |
| Thickener overflow clarity | <500 ppm TSS | Sample test | Hourly |
| Product moisture | <12% | Moisture meter | Per load |
Conclusion
Water balance analysis transforms water management from guesswork to engineering. Track inputs and outputs systematically, size recirculation components appropriately, and monitor key parameters continuously. Well-designed systems achieve 85-90% recirculation, reducing fresh water consumption to 0.2-0.4 m³/tonne while meeting environmental requirements and reducing operating costs.