Your quarry blasts produce 40% boulders exceeding your jaw crusher's maximum feed size (900mm), forcing costly secondary blasting that adds ₹18/ton and delays production 6-8 hours per blast. Yet optimizing blast design to produce 80% of material in the crusher's ideal feed range (400-700mm) eliminates secondary blasting while increasing crusher throughput 22-28%. The principle: jaw crushers achieve maximum efficiency with feed size distribution matching their geometry—not just maximum size compliance but optimal size distribution that fills the crushing chamber without blocking or bridging.
Jaw crusher performance depends critically on feed size distribution—not merely whether material fits the feed opening, but how particle sizes distribute across the crusher's working range. A 1200×900mm jaw crusher accepts 900mm maximum feed, but optimal performance requires 75-85% of feed mass in the 300-700mm range (33-78% of maximum feed size). This "80/20 rule" states that 80% of crusher capacity comes from properly sized material in the mid-range, while only 20% comes from maximum-size boulders. Violating this distribution reduces throughput 20-30%, increases specific energy consumption 15-25%, and accelerates liner wear 30-40%.
This guide examines feed size distribution principles, their relationship to blasting practices and crusher geometry, and optimization strategies that maximize throughput while minimizing operating costs—demonstrating how proper feed gradation delivers 25% throughput improvement without equipment changes.
Understanding Jaw Crusher Feed Size Dynamics
Crushing Chamber Geometry and Particle Interaction
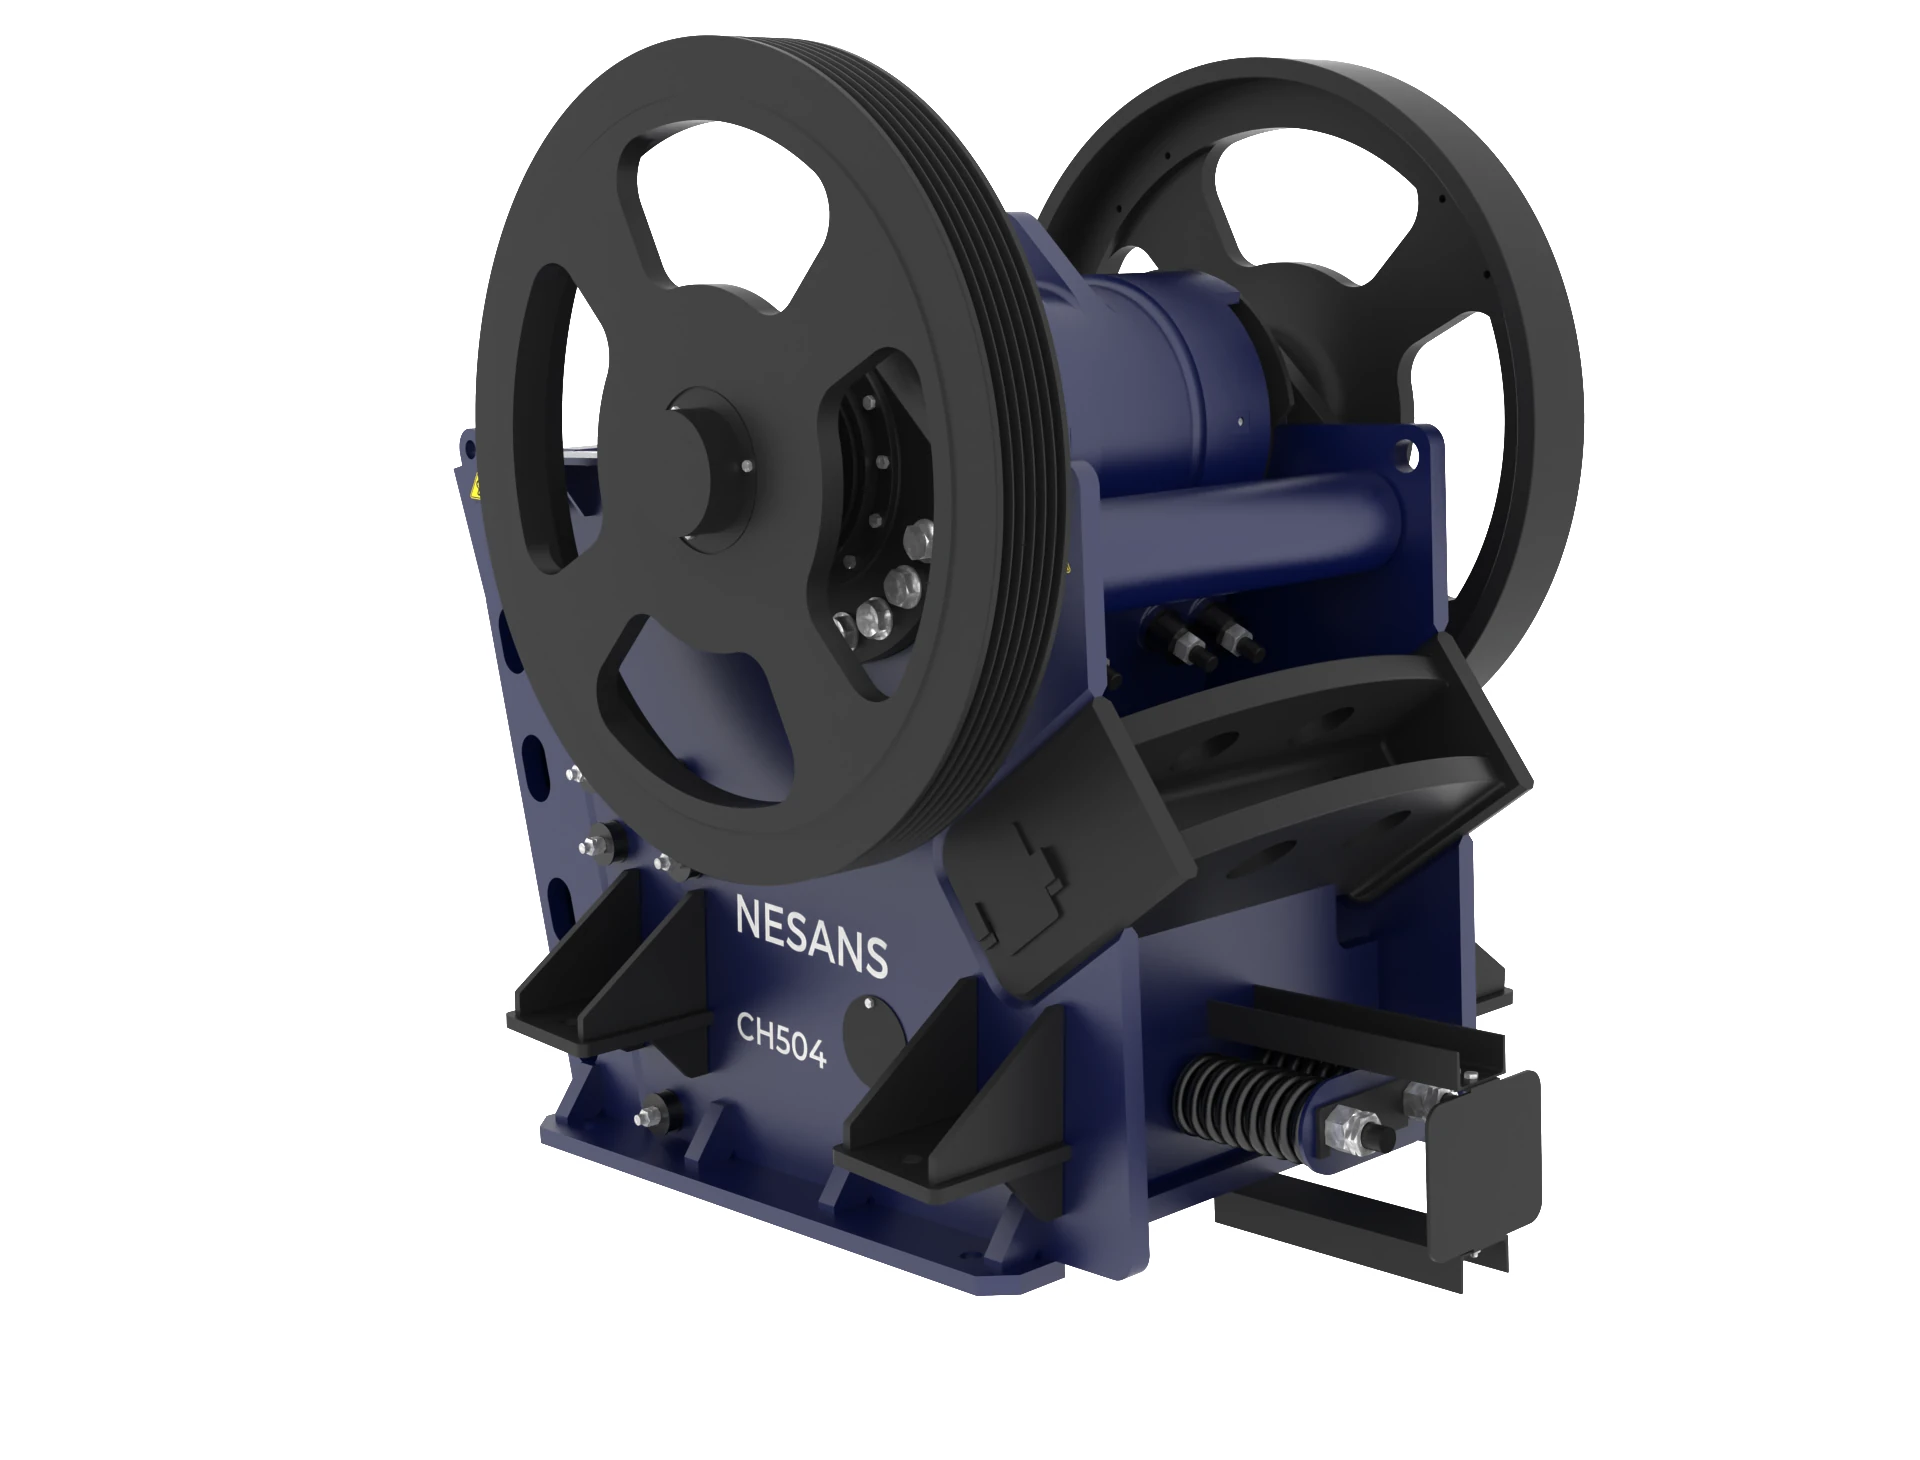
Jaw crushers achieve size reduction through compression between a fixed jaw plate and a moving jaw that oscillates in an elliptical pattern. Feed particles enter at the top (feed opening) and progressively move downward as they are crushed, eventually discharging at the bottom (closed-side setting or CSS).
Critical Size Zones:
- Maximum Feed Size (MFS): 80-85% of feed opening width for unrestricted entry. A 900mm opening accommodates 720-765mm maximum particle size.
- Optimal Feed Range (OFR): 35-80% of feed opening (315-720mm for 900mm opening). Material in this range enters freely, fills chamber efficiently, and crushes progressively.
- Small Feed Fraction (SFF): <30% of feed opening (<270mm for 900mm opening). Passes through chamber with minimal crushing action—represents recirculating load from screens.
- Oversize Fraction (OSF): >85% of feed opening (>765mm for 900mm opening). Bridges across feed opening, restricts material flow, reduces throughput 40-60%.
Throughput Relationship to Feed Size Distribution:
Crusher capacity (tons/hour) depends on material bulk density, compressive strength, and feed size distribution. For a given crusher geometry and CSS:
- Ideal Distribution (80/20 Rule): 75-85% of feed in optimal range, 10-15% small fraction, 5-10% maximum size → Achieves 100% rated capacity
- Top-Heavy Distribution: 25-40% maximum-size boulders, 50-60% optimal range → Reduces capacity to 65-75% of rated (bridging and restricted flow)
- Bottom-Heavy Distribution: 60-75% small fraction, 20-30% optimal range → Reduces capacity to 70-80% of rated (insufficient chamber filling, high recirculation)
⚠️ Economic Impact Example: A 300 TPH-rated jaw crusher fed with top-heavy distribution (40% boulders >800mm) achieves only 215-225 TPH actual throughput. Optimizing blast fragmentation to produce 80% material in 350-750mm range increases throughput to 280-295 TPH (30-37% improvement) without equipment changes. At ₹400/ton aggregate margin, this generates additional ₹6.5-8 lakhs daily revenue (₹19.5-24 crores annually) from the same capital investment.
Quantifying Feed Size Distribution
Measurement Methods
Manual Sampling and Measurement:
- Stop production and extract representative sample (2-3 tons minimum for coarse aggregate)
- Spread material on flat surface and measure individual particles (300-500 pieces)
- Measure maximum dimension for each particle (length of longest axis)
- Group measurements into size classes (e.g., 0-200mm, 200-400mm, 400-600mm, 600-800mm, 800-1000mm, >1000mm)
- Calculate cumulative percentage passing each size
- Labor intensive: 4-6 hours per test, ₹8,000-12,000 cost including production downtime
Image Analysis Systems (Preferred Method):
- Digital photography of material on conveyor or truck beds
- Software analyzes particle outlines and calculates size distribution
- Real-time continuous monitoring without production interruption
- Accuracy: ±5-8% compared to manual measurement
- System cost: ₹8-15 lakhs for camera, software, and installation
- ROI: 12-18 months for operations optimizing blasting or crusher feed
Key Distribution Parameters
P80 (80th Percentile Size):
- Size at which 80% of material (by mass) is finer
- Most important parameter for crusher performance prediction
- Target: P80 = 50-65% of crusher feed opening for optimal performance
- Example: 900mm feed opening → Target P80 = 450-585mm
Top Size (P100):
- Largest particle in feed distribution
- Must not exceed 80-85% of crusher feed opening
- Occasional oversize acceptable (<2% frequency), but consistent oversize requires crushing or secondary blasting
D50 (Median Size):
- Size at which 50% of material is finer and 50% coarser
- Indicates distribution center—useful for comparing blast patterns
- Target: D50 = 35-45% of crusher feed opening
Blast Design for Optimal Feed Size Distribution
Relationship Between Blasting Parameters and Fragmentation
Rock fragmentation during blasting follows predictive models that relate explosive energy, rock properties, and blast geometry to particle size distribution.
Key Blast Design Variables:
1. Burden and Spacing:
- Burden (B): Distance from blast hole to free face—primary variable controlling fragmentation
- Spacing (S): Distance between adjacent blast holes in a row
- Optimal ratio: S/B = 1.0-1.4 for most rock types
- Reducing burden improves fragmentation: P80 decreases approximately 15-20% when burden reduced from 4.5m to 3.8m (keeping powder factor constant)
- Excessive burden (B >4.5m in hard rock) creates large boulders and poor fragmentation
2. Powder Factor (Specific Charge):
- Explosive mass per cubic meter of rock (kg/m³)
- Typical range: 0.25-0.45 kg/m³ for medium-hard rock (limestone, dolomite), 0.40-0.70 kg/m³ for hard rock (granite, quartzite)
- P80 relationship: Higher powder factor produces finer fragmentation
- Example: Increasing powder factor from 0.35 to 0.45 kg/m³ reduces P80 from 520mm to 425mm (18% improvement)
3. Timing and Initiation Sequence:
- Delay timing between holes controls rock movement and collision, affecting fragmentation
- Optimal inter-hole delay: 3-6 milliseconds per meter of burden (12-27ms for 4.5m burden)
- Proper timing reduces P80 by 10-15% compared to instantaneous firing
- Pattern initiation (V-pattern or progressive) influences fragment size distribution
Case Study: Granite Quarry Blast Optimization
Initial Situation
Operation Characteristics:
- Hard granite (UCS 180-210 MPa)
- Bench height: 12m, drilling with 150mm diameter holes
- Primary jaw crusher: 1200×900mm feed opening, rated 350 TPH
- Production target: 280-300 TPH crushed product
Baseline Blast Design:
- Burden: 4.8m, Spacing: 5.5m (S/B = 1.15)
- Charge: 115 kg ANFO per hole, 12m charge length, 3.5m stemming
- Powder factor: 0.37 kg/m³
- Timing: 42ms inter-hole delay, 100ms inter-row delay
Baseline Fragmentation Results:
- P80: 685mm (76% of feed opening—above optimal range)
- D50: 385mm
- Top size: 1,100-1,350mm (exceeds feed opening 22-50%)
- Oversize frequency: 35-42% of material >800mm
Crusher Performance Issues:
- Actual throughput: 235-255 TPH (67-73% of rated capacity)
- Secondary blasting required: 3-4 blasts per week, ₹35,000-45,000 cost per blast
- Secondary blasting delays: 6-8 hours production loss per blast (₹4.5-6 lakhs revenue loss)
- Specific energy: 2.8-3.1 kWh/ton (15-20% above typical)
Optimization Implementation
Revised Blast Design:
- Burden: 4.2m (reduced 12.5%), Spacing: 5.0m (S/B = 1.19)
- Charge: 115 kg per hole (unchanged), 12m charge length
- Powder factor: 0.46 kg/m³ (increased 24% due to reduced burden/spacing)
- Timing: 25ms inter-hole delay (optimized), 100ms inter-row delay
- Cost impact: 24% increase in explosive cost (more holes per blast)
Results:
- P80: 525mm (58% of feed opening—within optimal range)
- D50: 310mm
- Top size: 850-920mm (within crusher capacity)
- Oversize frequency: 12-15% material >800mm (71% reduction)
Crusher Performance Improvement:
- Throughput: 295-315 TPH (84-90% of rated capacity, 25-35% improvement)
- Secondary blasting: Reduced to 1-2 per month (86% reduction)
- Specific energy: 2.4-2.6 kWh/ton (14-23% reduction)
Economic Analysis:
- Blasting cost increase: ₹12/ton (24% more explosive)
- Secondary blasting cost reduction: ₹5.1 lakhs/month
- Production delay elimination: ₹63 lakhs/month
- Throughput value: 50 TPH × 480 hours/month × ₹400/ton margin = ₹96 lakhs/month additional revenue
Net Monthly Benefit: ₹155.8 lakhs (₹18.7 crores annually)
Conclusion
Jaw crusher throughput depends more on feed size distribution than maximum particle size. The 80/20 rule—where 80% of crushing efficiency comes from properly sized material (35-80% of feed opening) and only 20% from maximum-size particles—explains why crushers fed with top-heavy distributions underperform by 25-40% despite technically accepting all material.
Optimizing blast fragmentation to produce P80 at 50-65% of crusher feed opening eliminates secondary blasting (saving ₹5-8 lakhs monthly), increases primary crusher throughput 25-35% (generating ₹50-100 lakhs additional monthly revenue), and reduces specific energy 12-20%. Even with 20-30% higher blasting costs, net benefit reaches ₹100-160 lakhs monthly for a typical 300 TPH operation—representing ₹12-19 crores annual improvement from optimizing feed size distribution.
For quarries currently secondary blasting or underutilizing primary crusher capacity, feed size optimization represents the single highest-return operational improvement available.

