


Your sand washing plant processes 150 TPH of crusher fines, producing washed sand for the construction market. But the thickener overflow carries a milky white stream back to the settling pond—15-20 TPH of fine sand that took energy to crush, water to wash, and represents ₹800-1,200 per ton in lost revenue. Over a year, that's ₹3-4 crores flowing into your settling pond instead of your stockpile. Fine sand recovery systems, built around hydrocyclone technology, capture 85-95% of this lost material, transforming waste streams into profit centers while reducing settling pond volumes and environmental impact.
Fine sand recovery represents one of the highest-ROI investments available to sand washing operations. The technology is proven, the equipment is reliable, and the payback periods typically measure in months rather than years. Yet many operations continue losing valuable fines because they don't understand the technology, haven't calculated the true loss, or fear operational complexity.
This comprehensive guide covers hydrocyclone principles, fine sand recovery system design, operational optimization, and economic analysis. We provide specific sizing calculations, performance predictions, and troubleshooting procedures for Indian aggregate and sand operations. Whether recovering fines from natural sand washing or manufactured sand production, this analysis enables informed decisions and optimal system performance.
Chapter 1: The Fine Sand Loss Problem
1.1 Understanding Where Fines Go
In typical sand washing operations, water carries sand particles through various processes. Particles settle based on size, density, and water velocity—larger particles settle quickly while finer particles remain suspended.
Typical Sand Washing Water Circuit:
| Process Stage | Water Flow | Sand Carried | Typical Loss Point |
|---|---|---|---|
| Washer feed | 1.5-2.5 m³/ton sand | All fractions | None |
| Bucket wheel/spiral | With sand slurry | Coarse and medium | Minor |
| Washer overflow | 0.8-1.5 m³/ton | -75µm to -150µm | Major loss point |
| Dewatering screen | Drain water | -75µm | Moderate |
| Thickener overflow | Clarified water | -45µm | Minor (if functioning) |
| Settling pond | All overflow | All fines not recovered | Accumulation point |
Quantifying Fine Sand Losses:
| Feed Type | Total -75µm in Feed | -75µm to -150µm | Recoverable (75-600µm) | Typical Loss Rate |
|---|---|---|---|---|
| Natural river sand | 5-15% | 2-8% | 3-7% | 8-15% of feed |
| Manufactured sand (VSI) | 12-20% | 5-12% | 7-8% | 12-18% of feed |
| Manufactured sand (cone) | 8-15% | 3-8% | 5-7% | 10-15% of feed |
| Washed aggregates | 3-8% | 1-4% | 2-4% | 5-10% of feed |
1.2 Economic Impact Analysis
Annual Loss Calculation Example:
Operation: 200 TPH sand washing plant, 10 hours/day, 300 days/year
| Parameter | Without Recovery | With Recovery (90%) | Difference |
|---|---|---|---|
| Annual feed volume | 600,000 tons | 600,000 tons | - |
| Fine sand loss rate | 12% | 1.2% | 10.8% |
| Annual fine sand loss | 72,000 tons | 7,200 tons | 64,800 tons saved |
| Fine sand value (₹/ton) | 900 | 900 | - |
| Annual revenue impact | ₹6.48 Cr loss | ₹0.65 Cr loss | ₹5.83 Cr recovered |
| Settling pond volume | 48,000 m³/year | 4,800 m³/year | 43,200 m³ reduction |
| Pond cleaning cost | ₹24 lakhs/year | ₹2.4 lakhs/year | ₹21.6 lakhs saved |
Hidden Costs of Fine Sand Loss:
| Hidden Cost | Description | Typical Annual Cost |
|---|---|---|
| Settling pond construction | Larger ponds needed for solids | ₹10-30 lakhs amortized |
| Pond cleaning | Excavation and disposal of fines | ₹15-40 lakhs |
| Water treatment | Flocculant to settle fines | ₹8-20 lakhs |
| Environmental compliance | Turbidity limits, inspections | ₹2-5 lakhs |
| Water loss | Fines carry water to pond | ₹3-8 lakhs |
| Product quality | Loss of fines changes gradation | Market price impact |
Chapter 2: Hydrocyclone Technology Fundamentals
2.1 How Hydrocyclones Work
Hydrocyclones use centrifugal force to separate particles by size and density. Unlike gravity settling that relies on 1g, cyclones generate 500-2,000g forces, dramatically accelerating the separation process.
Hydrocyclone Operating Principle:
- Tangential Feed Entry: Slurry enters cyclone tangentially under pressure (0.5-2.5 bar)
- Vortex Formation: Tangential entry creates spinning vortex inside cylindrical section
- Centrifugal Separation: Heavy/coarse particles migrate to wall, fine/light stay central
- Underflow Discharge: Coarse particles spiral down and exit through apex (spigot)
- Overflow Discharge: Fine particles carried up by inner vortex, exit through vortex finder
Key Hydrocyclone Dimensions:
| Dimension | Symbol | Effect on Performance | Typical Range |
|---|---|---|---|
| Cyclone Diameter | Dc | Larger = coarser cut, higher capacity | 100-800mm for sand |
| Inlet Diameter | Di | Larger = higher capacity, coarser cut | 0.15-0.25 × Dc |
| Vortex Finder Diameter | Do | Larger = coarser cut, more overflow | 0.25-0.40 × Dc |
| Vortex Finder Length | Lo | Longer = finer cut, prevents short-circuit | 0.5-1.0 × Dc |
| Apex (Spigot) Diameter | Du | Larger = coarser cut, more underflow | 0.10-0.25 × Dc |
| Cone Angle | θ | Smaller = finer cut, higher pressure drop | 10-20 degrees |
| Cylindrical Length | Lc | Longer = finer cut | 0.5-1.0 × Dc |
2.2 Cut Point and Efficiency
D50 Cut Point Concept:
The D50 (or d50) represents the particle size at which 50% reports to underflow and 50% to overflow. It's the key specification for hydrocyclone sizing.
| Cyclone Diameter (mm) | Typical D50 Range (µm) | Capacity Range (m³/hr) | Application |
|---|---|---|---|
| 100 | 10-30 | 3-8 | Ultra-fine classification |
| 150 | 20-45 | 8-20 | Fine sand recovery |
| 250 | 35-75 | 25-60 | Sand classification |
| 350 | 50-100 | 50-120 | Sand washing |
| 500 | 75-150 | 100-250 | Coarse sand, desliming |
| 650 | 100-200 | 180-400 | High-capacity desliming |
Partition Curve and Efficiency:
The partition curve shows the probability of each size fraction reporting to underflow:
| Particle Size vs D50 | Recovery to Underflow | Classification |
|---|---|---|
| 3× D50 | 95-99% | Essentially all to underflow |
| 2× D50 | 85-95% | Mostly to underflow |
| 1.5× D50 | 70-85% | Majority to underflow |
| 1× D50 | 50% | Equal split |
| 0.7× D50 | 25-35% | Majority to overflow |
| 0.5× D50 | 10-20% | Mostly to overflow |
| 0.3× D50 | 3-8% | Essentially all to overflow |
2.3 Operating Parameters
Pressure Requirements:
| Application | Feed Pressure (bar) | Effect of Higher Pressure |
|---|---|---|
| Coarse classification (>150µm) | 0.5-1.0 | Finer cut, higher capacity |
| Fine sand recovery (75-150µm) | 1.0-1.5 | Better efficiency |
| Ultra-fine (<75µm) | 1.5-2.5 | Required for fine cuts |
Feed Density Effects:
| Feed % Solids (by weight) | Effect on Cut Point | Effect on Capacity | Recommended Use |
|---|---|---|---|
| 5-10% | Finest achievable | Lower solids throughput | Precision classification |
| 10-20% | Near-optimal | Good balance | General sand recovery |
| 20-30% | Coarsening | Higher throughput | Desliming |
| 30-40% | Significant coarsening | Risk of roping | Not recommended |
Chapter 3: Fine Sand Recovery System Design
3.1 System Components
Complete Fine Sand Recovery System:
| Component | Function | Sizing Basis |
|---|---|---|
| Collection Sump | Collects overflow from washers/screens | 2-5 minute retention |
| Slurry Pump | Feeds hydrocyclones under pressure | Flow rate + head required |
| Hydrocyclone(s) | Classifies and concentrates fines | Cut point + capacity |
| Dewatering Screen | Removes water from cyclone underflow | TPH + particle size |
| Overflow Launder | Collects cyclone overflow | Flow rate |
| Piping and Valves | Connects components | Flow rate + pressure |
| Control System | Monitors and adjusts operation | Automation level |
3.2 Sump Design
Collection Sump Requirements:
| Parameter | Guideline | Reasoning |
|---|---|---|
| Retention time | 2-4 minutes | Buffer for flow variations |
| Sump shape | Conical or sloped bottom (45° min) | Prevent settling |
| Agitation | Required if >3 min retention | Keep solids suspended |
| Level control | High/low switches + variable speed pump | Maintain cyclone feed consistency |
| Pump suction | Submerged, off bottom | Prevent air entrainment |
Sump Sizing Example:
For 150 m³/hr slurry flow with 3-minute retention:
- Volume required: 150 × (3/60) = 7.5 m³
- Add 30% freeboard: 7.5 × 1.3 = 9.75 m³
- Practical size: 10 m³ working volume
- Dimensions (conical): 2.5m diameter × 2.5m cylinder + 1m cone
3.3 Pump Selection
Slurry Pump Requirements:
| Parameter | Determination Method | Safety Factor |
|---|---|---|
| Flow rate | Sum of all feed streams | +15-20% |
| Head requirement | Static lift + cyclone pressure + friction | +10% |
| Solids concentration | Measured or calculated | Design for maximum |
| Particle size | Screen analysis | D85 for impeller passage |
| Abrasiveness | Material testing | Affects material selection |
Pump Sizing Example:
System: 150 m³/hr, 15% solids, 25m TDH (including 1.2 bar cyclone pressure)
| Parameter | Value | Calculation |
|---|---|---|
| Design flow | 180 m³/hr | 150 × 1.2 |
| Design head | 27.5 m | 25 × 1.1 |
| Water power | 13.4 kW | (180 × 27.5 × 1.0)/(367 × 0.98) |
| Slurry SG | 1.09 | 1 + 0.15 × (2.65-1)/2.65 |
| Slurry power | 14.6 kW | 13.4 × 1.09 |
| Pump efficiency | 65% | Typical for slurry |
| Motor power | 22.5 kW | 14.6/0.65 |
| Installed motor | 30 kW | Next standard size |
3.4 Hydrocyclone Sizing
Cyclone Selection Process:
- Determine Required Cut Point: What size do you want to recover?
- Calculate Slurry Flow: Total flow to cyclone(s)
- Select Cyclone Diameter: Based on D50 requirement
- Calculate Number of Cyclones: Total flow ÷ single cyclone capacity
- Select Apex Size: Based on underflow density requirement
- Verify Pressure: Pump head matches cyclone requirement
D50 Estimation Formula (simplified):
D50 (µm) = 4.5 × Dc^0.46 × Di^0.21 × Do^0.50 × Du^-0.36 × ΔP^-0.28 × μ^0.43 × (ρs-ρl)^-0.50
Where: Dc = cyclone diameter (cm), ΔP = pressure drop (kPa), µ = viscosity, ρ = densities
Practical Cyclone Selection Table (for sand at 1.5 bar):
| Target D50 (µm) | Cyclone Diameter | Capacity Each (m³/hr) | Standard Apex (mm) |
|---|---|---|---|
| 30-45 | 150mm | 15-25 | 20-30 |
| 45-60 | 200mm | 25-45 | 25-40 |
| 60-80 | 250mm | 40-70 | 35-50 |
| 80-100 | 350mm | 70-120 | 45-65 |
| 100-130 | 500mm | 120-200 | 60-85 |
3.5 Dewatering Screen Selection
Dewatering Screen Types for Cyclone Underflow:
| Screen Type | Capacity (TPH/m²) | Moisture Result | Best Application |
|---|---|---|---|
| Inclined (15-20°) | 10-15 | 15-18% | General, low cost |
| Horizontal linear | 12-18 | 12-15% | Better dewatering |
| Horizontal elliptical | 15-25 | 10-13% | Best dewatering |
| High-frequency | 20-30 | 10-12% | Fine sand, premium |
Dewatering Screen Sizing:
For 25 TPH fine sand recovery with target <15% moisture:
| Parameter | Calculation | Result |
|---|---|---|
| Required area (horizontal) | 25 ÷ 15 | 1.67 m² |
| Add 20% safety | 1.67 × 1.2 | 2.0 m² |
| Standard screen | Select next size up | 1.5m × 3.6m (5.4 m²) |
| Actual capacity | 5.4 × 15 | 81 TPH maximum |
Chapter 4: System Configurations
4.1 Basic Fine Sand Recovery
Single-Stage Recovery System:
- Configuration: Sump → Pump → Cyclone(s) → Dewatering Screen
- Cut point: Single D50, typically 75-100µm
- Recovery: 85-90% of target size fraction
- Product moisture: 12-18%
- Best for: Operations with moderate fines, simple installation
Investment Range: ₹35-60 lakhs for 50-100 TPH system
4.2 Two-Stage Classification
When Two Stages Are Needed:
- High fines content (>15% below 75µm)
- Specific gradation requirements
- Need to reject ultra-fines (<45µm)
- High clay content requiring desliming
Configuration Options:
| Configuration | First Stage D50 | Second Stage D50 | Purpose |
|---|---|---|---|
| Desliming + Recovery | 200µm | 75µm | Remove clay, recover fines |
| Coarse + Fine Split | 300µm | 100µm | Two sand products |
| Fine + Ultra-fine | 100µm | 45µm | Maximum recovery |
4.3 Integrated Washing Systems
Sand Washing Plant with Fine Recovery:
| Component | Function | Output |
|---|---|---|
| Feed hopper/screen | Remove oversize | Sized feed to washer |
| Spiral/bucket washer | Scrub and wash coarse sand | Clean coarse sand + overflow |
| Hydrocyclone(s) | Classify washer overflow | Fine sand + tailings |
| Dewatering screen | Dewater cyclone underflow | Stackable fine sand |
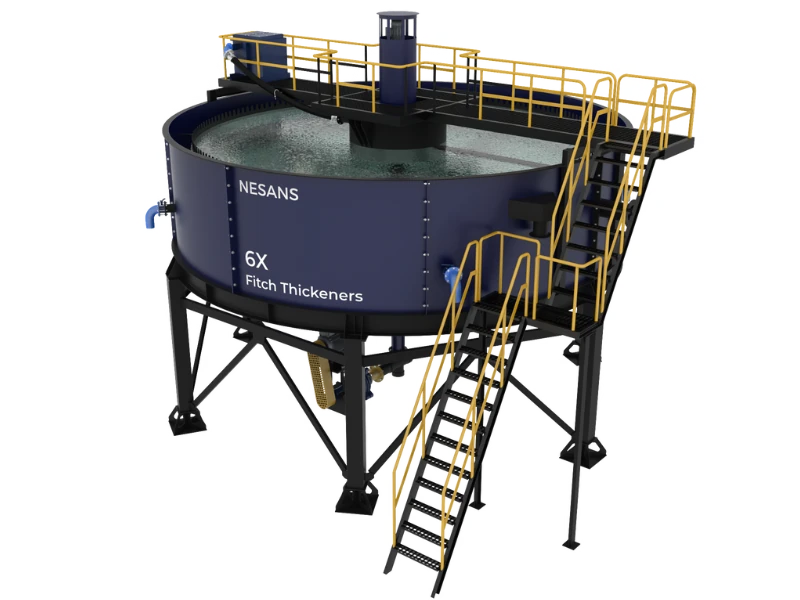
| Thickener | Concentrate cyclone overflow | Underflow to disposal, clear water |
| Water recycling | Return clarified water | Reduced freshwater use |
Complete Washing + Recovery Plant Capacities:
| Plant Size | Feed TPH | Water (m³/hr) | Power (kW) | Typical Investment |
|---|---|---|---|---|
| Small | 50-80 | 100-150 | 60-100 | ₹80-120 lakhs |
| Medium | 100-150 | 180-280 | 120-180 | ₹150-220 lakhs |
| Large | 200-300 | 350-500 | 220-350 | ₹280-400 lakhs |
| Extra Large | 400-500 | 650-900 | 400-550 | ₹450-650 lakhs |
Chapter 5: Operational Optimization
5.1 Start-Up Procedure
Correct Start-Up Sequence:
- Pre-Start Checks:
- Verify sump level adequate for pump priming
- Check cyclone apex and vortex finder installed correctly
- Confirm dewatering screen ready
- Verify all valves in correct position
- Start Dewatering Screen: Must be running before material arrives
- Start Slurry Pump: Begin at reduced speed or with discharge partially closed
- Verify Cyclone Operation:
- Check for spray discharge at overflow (not rope)
- Verify underflow pattern (should be spray, not rope)
- Adjust pump speed to achieve target pressure
- Gradually Increase Feed: Allow system to stabilize
- Monitor and Adjust: Fine-tune apex, pressure as needed
5.2 Underflow Discharge Patterns
Critical: Identifying Correct Underflow Operation
| Pattern | Description | Indicates | Action |
|---|---|---|---|
| Spray (correct) | Hollow cone, 20-30° angle | Proper operation | Maintain |
| Wide spray | Cone angle >40° | Apex too large or feed too dilute | Reduce apex or increase feed density |
| Narrow spray | Cone angle <15° | Apex too small, nearing rope | Increase apex or reduce feed |
| Rope (bad) | Solid stream, no cone | Overloaded, bypassing fines | Immediately reduce feed or increase apex |
⚠️ Critical Warning: Roping represents cyclone failure. When underflow transitions from spray to rope, classification efficiency drops from 85-90% to 40-50%. All fines bypass to underflow, defeating the recovery purpose. Continuous roping also causes rapid apex wear.
5.3 Key Operating Variables
| Variable | Effect of Increase | Control Method |
|---|---|---|
| Feed pressure | Finer cut, higher capacity | Pump speed or valve |
| Feed density | Coarser cut, higher underflow density | Water addition or sump level |
| Apex diameter | Coarser cut, lower underflow density | Replace apex |
| Vortex finder diameter | Coarser cut, more overflow | Replace vortex finder |
| Feed rate | Coarser cut at same pressure | Pump speed or valves |
5.4 Monitoring Parameters
| Parameter | Target Range | Measurement Method | Frequency |
|---|---|---|---|
| Feed pressure | 1.0-1.5 bar (typical) | Pressure gauge | Continuous |
| Feed density | 10-20% solids | Density meter or marcy scale | Hourly |
| Underflow pattern | 20-30° spray cone | Visual | Every 15 minutes |
| Underflow density | 65-75% solids | Sample and weigh | Hourly |
| Recovery rate | >85% target fraction | Sample analysis | Per shift |
| Dewatered product moisture | 10-15% | Sample and dry | Per shift |
Chapter 6: Troubleshooting
6.1 Common Problems and Solutions
| Problem | Possible Causes | Solutions |
|---|---|---|
| Low recovery (<80%) | Cut point too coarse; feed too dense; roping | Reduce apex; increase pressure; check underflow pattern |
| Wet product (>18%) | Screen overloaded; screen blinded; low cyclone density | Reduce feed; clean/replace screen media; reduce apex |
| Cyclone roping | Apex too small; feed too dense; pressure too low | Increase apex; dilute feed; increase pump speed |
| Rapid apex wear | Roping; oversized particles; wrong material | Eliminate roping; improve feed sizing; ceramic apex |
| Pump cavitation | Sump level low; suction blocked; air entrainment | Maintain level; clear suction; check piping |
| Pressure fluctuation | Air in system; feed variation; worn pump | Eliminate air; stabilize feed; inspect pump |
| Vortex finder blocked | Debris; worn component; roping | Clear blockage; replace finder; eliminate roping |
6.2 Wear Component Life
| Component | Material Options | Expected Life (hours) | Replacement Indication |
|---|---|---|---|
| Apex | Rubber / Ceramic / Polyurethane | 500-2,000 / 2,000-5,000 / 1,000-3,000 | Increased diameter, roping |
| Vortex Finder | Rubber / Ceramic / Polyurethane | 1,000-3,000 / 4,000-10,000 / 2,000-5,000 | Visible wear, coarse cut |
| Cyclone Liner | Rubber / Ceramic / Polyurethane | 3,000-8,000 / 10,000-25,000 / 5,000-15,000 | Wall thickness reduction |
| Feed Inlet | Rubber / Ceramic | 2,000-6,000 / 8,000-20,000 | Visible wear, pressure increase |
| Pump Impeller | High-chrome / Rubber | 2,000-5,000 / 1,500-4,000 | Capacity loss, vibration |
| Pump Liner | High-chrome / Rubber | 3,000-8,000 / 2,500-6,000 | Efficiency loss, wear marks |
Chapter 7: Economic Analysis
7.1 Investment Cost Breakdown
100 TPH Fine Sand Recovery System:
| Component | Specification | Cost (₹ Lakhs) |
|---|---|---|
| Collection sump | 15 m³, steel with conical bottom | 3.5-5.0 |
| Slurry pump | 150 m³/hr, 25m head, 30 kW | 8.0-12.0 |
| Hydrocyclone cluster | 4 × 250mm, with manifold | 6.0-10.0 |
| Dewatering screen | 1.5m × 3.6m, horizontal | 12.0-18.0 |
| Structural steel | Platform, launders, supports | 4.0-6.0 |
| Piping and valves | Complete with flanges, supports | 3.0-5.0 |
| Electrical | Panel, cables, starters | 3.0-5.0 |
| Installation | Civil, mechanical, electrical | 6.0-10.0 |
| Total | - | 45.5-71.0 |
7.2 Operating Costs
| Cost Element | Consumption/Wear Rate | Unit Cost | ₹/ton recovered |
|---|---|---|---|
| Power (pump + screen) | 0.5-0.8 kWh/ton | ₹8/kWh | 4.0-6.4 |
| Pump wear parts | Replace every 3,000 hrs | ₹1.5 lakh/set | 2.0-3.0 |
| Cyclone wear parts | Apex: 1,500 hrs, VF: 3,000 hrs | ₹20,000/set | 1.5-2.5 |
| Screen media | Replace every 2,500 hrs | ₹1.2 lakh/set | 2.0-3.0 |
| Labor | 0.5 man/shift | ₹500/shift | 1.0-1.5 |
| Maintenance misc | Allow 2% of equipment/year | - | 1.0-1.5 |
| Total Operating Cost | - | - | 11.5-17.9 |
7.3 ROI Calculation
Scenario: 150 TPH washing plant, 12% fines loss, 300 days × 10 hours
| Parameter | Value | Calculation |
|---|---|---|
| Annual feed | 450,000 tons | 150 × 10 × 300 |
| Recoverable fines | 54,000 tons | 450,000 × 12% |
| Recovery rate | 90% | System efficiency |
| Fine sand recovered | 48,600 tons | 54,000 × 90% |
| Fine sand value | ₹900/ton | Market price |
| Gross revenue | ₹4.37 Cr | 48,600 × 900 |
| Operating cost | ₹0.73 Cr | 48,600 × 15 |
| Net annual benefit | ₹3.64 Cr | Revenue - operating cost |
| Investment | ₹0.60 Cr | System cost |
| Simple Payback | 2 months | 0.60/3.64 × 12 |
| 5-Year ROI | 2,933% | (3.64 × 5 - 0.60)/0.60 |
Chapter 8: Conclusion
8.1 Key Takeaways
- Fine sand loss is significant: 10-18% of feed material typically lost without recovery
- Recovery technology is proven: Hydrocyclones reliably achieve 85-95% recovery
- ROI is exceptional: Typical payback periods of 2-6 months
- Operation is manageable: With proper monitoring, systems run reliably
- Hidden benefits add value: Reduced pond volumes, water recycling, environmental compliance
8.2 Implementation Checklist
- ☐ Measure current fine sand losses (sample overflow streams)
- ☐ Analyze particle size distribution of losses
- ☐ Calculate potential recovery value
- ☐ Define target cut point based on product requirements
- ☐ Size system components (sump, pump, cyclones, screen)
- ☐ Evaluate space and infrastructure requirements
- ☐ Obtain quotations from suppliers
- ☐ Calculate full ROI including operating costs
- ☐ Plan installation timing to minimize disruption
- ☐ Develop operating procedures and training
8.3 Support Resources
For fine sand recovery system design, sizing calculations, or operational optimization, contact Nesans technical team at service@nesansindia.in. We provide:
- Site Assessment: Measure losses and recovery potential
- System Design: Application-specific engineering
- Equipment Supply: Complete systems or components
- Installation Support: Commissioning and operator training
- Optimization Services: Fine-tune existing systems