


Dewatering screen performance directly determines product moisture content and fines loss—two factors that significantly impact product value and operating costs. A properly optimized dewatering screen achieves 12-15% moisture content while recovering 85-90% of feed solids. This guide provides the technical framework for optimizing screen performance through equipment setup and operating parameter adjustment.
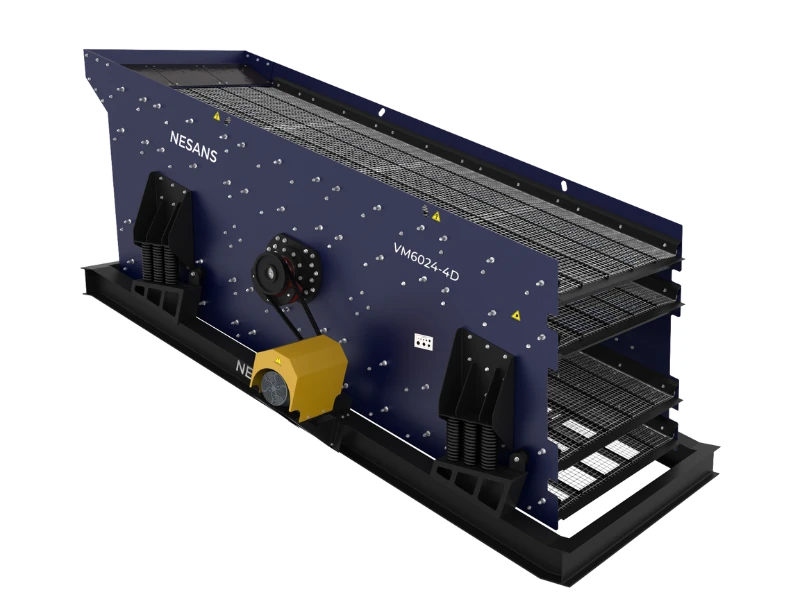
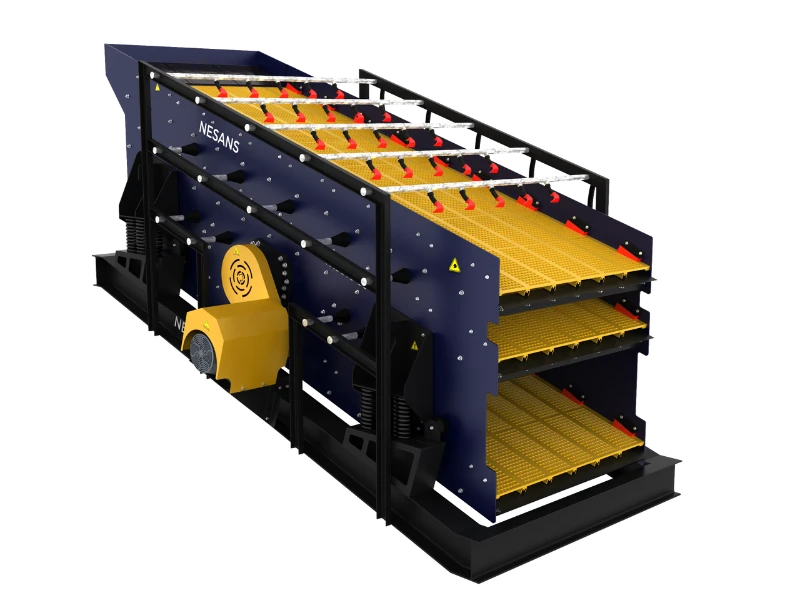
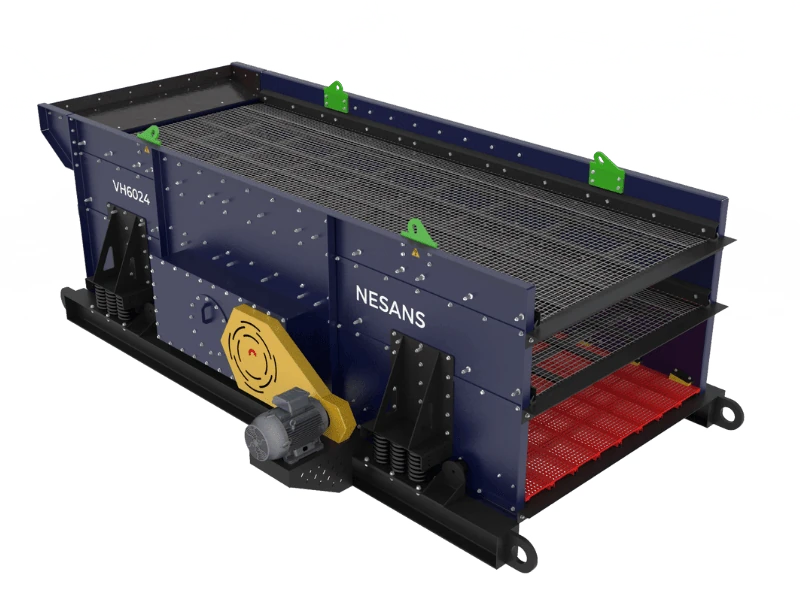
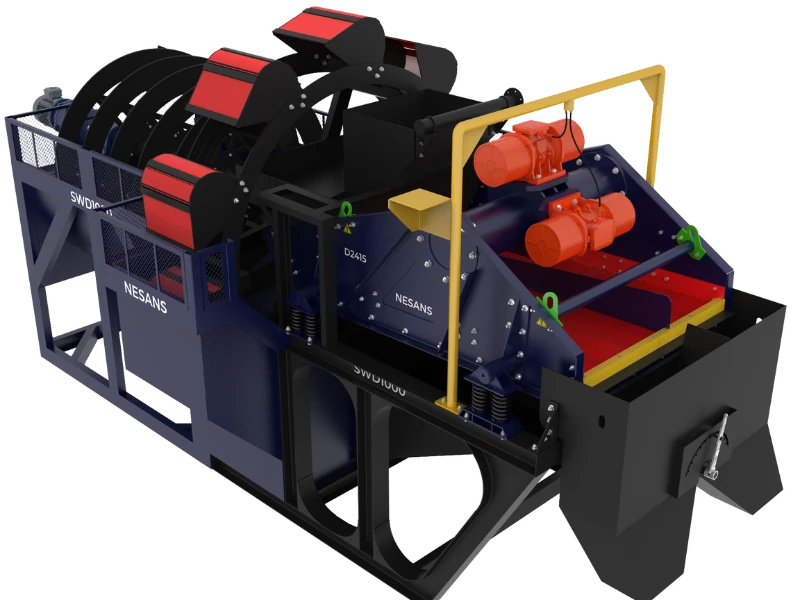
Dewatering Screen Fundamentals
How Dewatering Works
Dewatering screens use high-frequency vibration and drainage to remove free water from sand slurry. The process involves:
- Drainage zone: Free water drains through screen media (first 30-40% of deck)
- Compaction zone: Vibration compacts solids, expelling interstitial water (middle 30%)
- Discharge zone: Final moisture reduction before discharge (final 30%)
Target Performance Parameters
| Parameter | Standard Performance | Optimized Performance |
|---|---|---|
| Product moisture | 15-20% | 12-15% |
| Solids recovery | 75-85% | 85-92% |
| Screen efficiency | 70-80% | 85-95% |
| Fines loss (<75μm) | 15-25% | 8-15% |
Key Operating Parameters
| Parameter | Effect of Increase | Optimal Range |
|---|---|---|
| Feed rate | Wetter product, higher recovery | 80-90% of rated capacity |
| Feed solids % | Lower throughput, drier product | 40-60% solids by weight |
| Screen angle | Faster travel, wetter product | 5-15° uphill |
| Vibration frequency | Better drainage, more fines loss | 1200-1800 RPM |
| Stroke amplitude | Better drainage and conveying | 3-6mm |
Screen Media Selection
| Media Type | Aperture Range | Open Area | Best For |
|---|---|---|---|
| Polyurethane wedge wire | 0.25-1.0mm | 30-45% | Fine sand, abrasive material |
| Polyurethane panels | 0.3-2.0mm | 25-35% | General dewatering |
| Stainless wedge wire | 0.15-0.5mm | 40-55% | Ultra-fine recovery |
| Woven wire cloth | 0.2-1.0mm | 45-60% | Non-abrasive, low volume |
Aperture Sizing Rule
Aperture = 50-70% of D85 of desired product
This ensures most solids are retained while allowing water drainage.
Optimization Procedure
Step 1: Establish Baseline
- Measure current product moisture (oven dry method)
- Calculate solids recovery from feed and underflow analysis
- Document current operating parameters
Step 2: Feed Optimization
- Increase feed solids concentration if possible (reduces water load)
- Ensure consistent feed rate (avoid surges)
- Center feed across full deck width
Step 3: Parameter Adjustment
| Problem | Adjustment | Expected Result |
|---|---|---|
| Product too wet | Reduce feed rate or increase angle | 1-3% moisture reduction |
| Excessive fines loss | Reduce frequency, increase solids % | 5-10% better recovery |
| Low capacity | Increase angle, reduce stroke | 10-20% capacity gain |
| Inconsistent moisture | Stabilize feed rate | Reduced variance |
Spray System Optimization
If equipped with spray bars for final rinsing:
| Parameter | Optimal Setting | Effect |
|---|---|---|
| Spray location | First 20% of deck only | Minimizes moisture carryover |
| Spray rate | Minimum effective | Balances washing vs. moisture |
| Nozzle type | Flat fan, low pressure | Even coverage without flooding |
Troubleshooting
| Problem | Cause | Solution |
|---|---|---|
| Blinded screen | Fine particles lodged in apertures | Increase frequency, clean media |
| Uneven discharge | Off-center feed or worn media | Center feed, inspect media |
| Excessive vibration | Unbalanced weights, worn bearings | Check balance, inspect bearings |
| Poor drainage | Overfeeding or wrong aperture | Reduce rate, change media |
Conclusion
Dewatering screen optimization balances moisture reduction against solids recovery. Start with proper feed conditions, select appropriate media, and adjust operating parameters systematically. Document changes and results to build understanding of your specific installation. The 12-15% moisture target is achievable with consistent operation and attention to the factors detailed in this guide.