


Every crushing plant manager knows the feeling—production targets slipping, costs climbing, and pressure mounting for immediate improvements. While major capital investments and comprehensive overhauls deliver substantial gains, they require significant planning, budget approval, and extended timelines. What you need right now are quick wins—practical adjustments that your maintenance team can implement within hours or days, delivering measurable production improvements with minimal investment.
This comprehensive guide presents 10 field-proven optimization strategies that Indian crushing plant operators have successfully implemented to achieve 15-40% production improvements. Each strategy includes step-by-step implementation procedures, expected results, and common pitfalls to avoid. These aren't theoretical concepts—they're battle-tested techniques from operations across Tamil Nadu, Karnataka, Andhra Pradesh, and other crushing-intensive regions.
Understanding Plant Efficiency: Where Does Production Go?
Before implementing quick wins, understanding where production losses occur helps prioritize efforts. A typical 200 TPH crushing plant operating in India faces these common efficiency drains:
| Loss Category | Typical Impact | Recovery Potential | Implementation Effort |
|---|---|---|---|
| Feed system interruptions | 8-15% capacity loss | 60-80% recoverable | Low - adjustments only |
| Crusher choking/bridging | 10-20% capacity loss | 70-90% recoverable | Low - operational changes |
| Screen blinding/inefficiency | 5-12% capacity loss | 80-95% recoverable | Medium - maintenance required |
| Conveyor stoppages | 3-8% capacity loss | 90% recoverable | Low - inspection/adjustment |
| Electrical trips/resets | 2-5% capacity loss | 80% recoverable | Low - setting adjustments |
| Startup/shutdown procedures | 3-6% capacity loss | 50-70% recoverable | Low - procedural changes |
| Operator inefficiency | 5-15% capacity loss | 60-80% recoverable | Medium - training required |
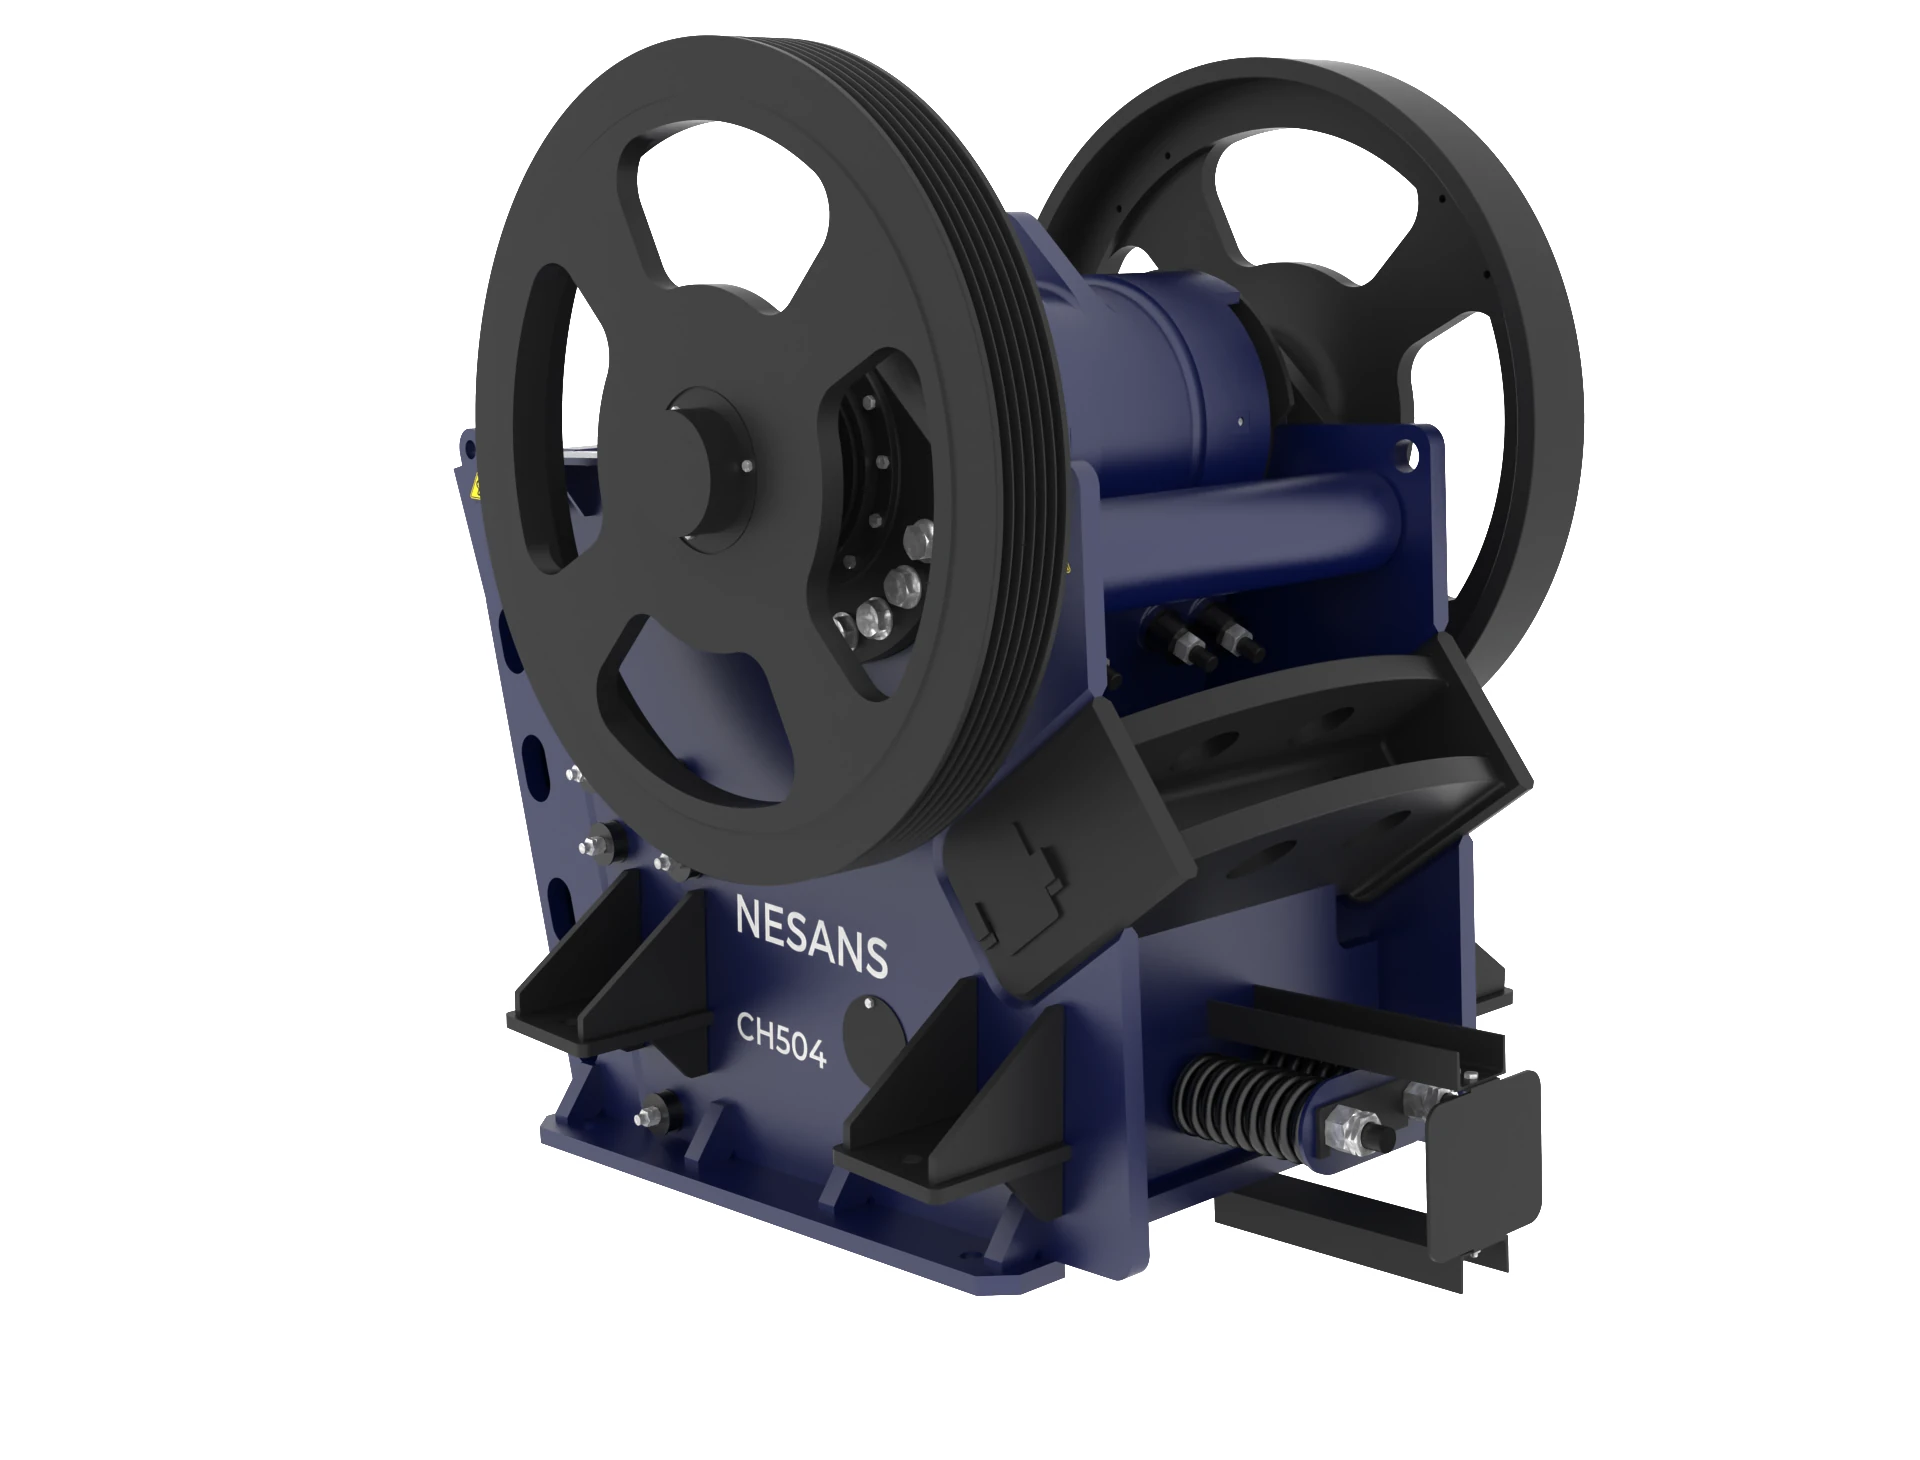
Quick Win #1: Optimize Jaw Crusher Feed Distribution
The single most impactful quick win in most crushing plants involves correcting improper jaw crusher feeding. Excavator operators naturally deposit material at the center of the hopper, creating concentrated feeding that causes bridging, uneven jaw wear, and reduced throughput.
The Problem in Detail
When material concentrates at the hopper center:
- Only 40-60% of the jaw crusher width processes material
- Center-fed material bridges across the crushing chamber
- Jaw plates wear unevenly—center wearing 3x faster than edges
- Actual throughput drops to 60-70% of rated capacity
- Power consumption per ton increases by 15-25%
Implementation Procedure
Step 1: Install Visual Feeding Guides
Mark the hopper with three distinct feeding zones using painted lines or welded markers visible to excavator operators. The zones should divide the hopper width into thirds.
Step 2: Train Excavator Operators
Spend 30 minutes with each operator explaining the feeding rotation: Left zone → Center zone → Right zone → repeat. Demonstrate how proper feeding affects crusher performance.
Step 3: Install Monitoring
Position a camera or mirror allowing the control room operator to observe feeding patterns. Create a simple checklist for hourly feeding pattern verification.
Step 4: Track Results
Monitor these metrics for two weeks before and after implementation:
- Hourly tonnage (production records)
- Power consumption per ton (meter readings)
- Bridging incidents per shift
- Jaw plate wear pattern (weekly measurement)
Expected Results
| Metric | Before Optimization | After Optimization | Improvement |
|---|---|---|---|
| Effective capacity utilization | 55-65% | 85-95% | +30-40% |
| Bridging incidents per shift | 8-15 | 1-3 | -80% |
| Power consumption (kWh/ton) | 2.8-3.2 | 2.2-2.5 | -20% |
| Jaw plate life | Baseline | +25-35% | Extended |
Quick Win #2: Calibrate Feeder Speed to Crusher Capacity
Most vibrating feeders operate at factory default settings, which rarely match actual crusher capacity or feed material characteristics. Proper speed calibration alone can increase throughput 10-20% while reducing crusher stress.
The Calibration Procedure
Step 1: Establish Baseline
Record current feeder speed setting (usually displayed in Hz or RPM). Measure actual feed rate by timing conveyor belt loads—count how long a marked section of belt takes to deliver material to the crusher.
Step 2: Observe Crusher Loading
Watch the crusher for 30 minutes at current settings:
- If crusher motor amperage fluctuates wildly (±30%): Feeder speed too variable
- If amperage consistently below 70% of rated: Feeder too slow
- If crusher stalls or motor trips: Feeder too fast
- Ideal: Steady amperage at 75-85% of rated, consistent crushing sound
Step 3: Incremental Adjustment
Adjust feeder speed in 5% increments. After each adjustment, observe for 15 minutes before further changes. Target steady crusher operation at 80% motor load.
Step 4: Document Optimal Settings
Record optimal feeder settings for different material conditions:
| Material Condition | Feeder Speed Setting | Expected Throughput |
|---|---|---|
| Dry, well-fragmented rock | Base + 10% | Maximum rated |
| Normal quarry blend | Base setting | 90% of rated |
| Wet or sticky material | Base - 15% | 75% of rated |
| Large boulder-heavy feed | Base - 20% | 70% of rated |
Quick Win #3: Correct Screen Deck Angle and Tension
Vibrating screens lose 20-40% efficiency when deck angle drifts or screen media tension relaxes. A two-hour inspection and adjustment session can restore full screening capacity.
Inspection Procedure
Angle Verification:
- Stop the screen and lock out power
- Place a digital inclinometer on the deck frame (not on screen media)
- Measure angle at feed end, center, and discharge end
- Compare to manufacturer specification (typically 15-20° for inclined screens)
- Variation should be less than 0.5° across the deck
Tension Verification:
- Press firmly on screen media at multiple points
- Properly tensioned media deflects 10-15mm under 20kg pressure
- Loose media "drums" when struck with a rubber mallet
- Over-tensioned media feels rigid and may show stretched openings
Adjustment Procedures
Angle Correction:
Adjust support structure shims to achieve correct angle. For screens mounted on springs, check spring condition—broken or fatigued springs cause angle drift. Replace springs in matched sets.
Tension Correction:
For hook-strip screens, tighten tensioning bolts in a cross pattern, checking tension after each adjustment. For modular screens, verify all modules are properly seated and locking pins are engaged.
Expected Improvements
| Issue Corrected | Efficiency Gain | Impact on Production |
|---|---|---|
| Angle off by 2-3° | +15-25% | Reduced oversize in fines, better separation |
| Loose screen media | +10-20% | Reduced blinding, consistent apertures |
| Uneven tension across deck | +8-15% | Uniform material flow, extended media life |
Quick Win #4: Eliminate Conveyor Belt Tracking Issues
Belt mistracking causes spillage, edge damage, and production interruptions. Most tracking problems stem from just 3-4 common causes, all correctable in under an hour.
Systematic Tracking Correction
Step 1: Clean the System
Before any adjustment, clean all pulleys, idlers, and belt surfaces. Material buildup is the #1 cause of mistracking. Pay special attention to return idlers where material accumulates on the dirty side.
Step 2: Check Belt Splice
Examine the belt splice for square alignment. A splice that's off-square by just 5mm can cause persistent mistracking. If the splice is worn or uneven, plan for replacement—no amount of idler adjustment will fully correct a bad splice.
Step 3: Verify Pulley Alignment
Using a string line or laser alignment tool, verify that head and tail pulleys are perpendicular to the conveyor centerline. Pulley misalignment is the second most common cause of tracking problems.
Step 4: Adjust Training Idlers
If dedicated training idlers are installed, adjust them to steer the belt. Remember: Tilt the idler end in the direction you want the belt to move. Make small adjustments (5mm maximum) and observe for several belt revolutions before further adjustment.
Tracking Troubleshooting Guide
| Symptom | Likely Cause | Correction |
|---|---|---|
| Belt tracks off at one specific point | Idler misalignment at that location | Realign that idler set |
| Belt wanders continuously | Off-square splice or belt camber | Replace splice or belt |
| Belt tracks off only when loaded | Off-center loading | Adjust loading chute or skirts |
| Belt tracks off only when empty | Idler or pulley crown worn | Replace crowned components |
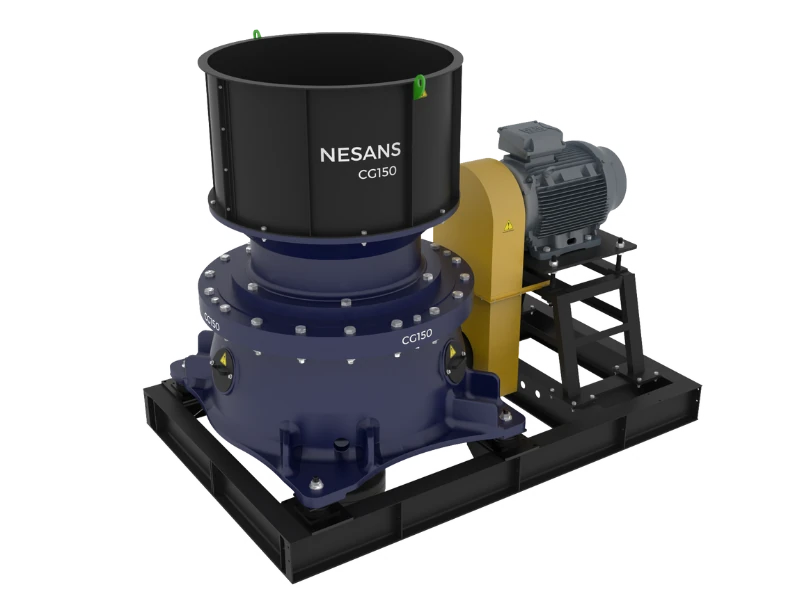
Quick Win #5: Optimize Crusher Closed-Side Setting
The closed-side setting (CSS) on cone and jaw crushers directly controls product gradation and throughput. Many plants operate with CSS settings unchanged from installation, missing opportunities for optimization.
CSS Optimization Process
Step 1: Measure Current CSS
For cone crushers, use lead ball or modeling clay method: Drop a soft lead ball through the crushing chamber, recover it, and measure the thinnest dimension. For jaw crushers, measure the gap at the closest point during the closed stroke.
Step 2: Analyze Current Product
Collect and sieve a representative sample of crusher product. Compare actual gradation to target specifications. Common findings:
- Excessive fines (< 4.75mm): CSS may be too tight
- Excessive oversize requiring recirculation: CSS may be too wide
- Good gradation but low tonnage: CSS may be too tight
Step 3: Calculate Optimal CSS
For most Indian aggregate specifications (IS 383 compliant), optimal CSS relates to maximum product size:
- For 20mm maximum product: CSS = 18-22mm
- For 12mm maximum product: CSS = 10-13mm
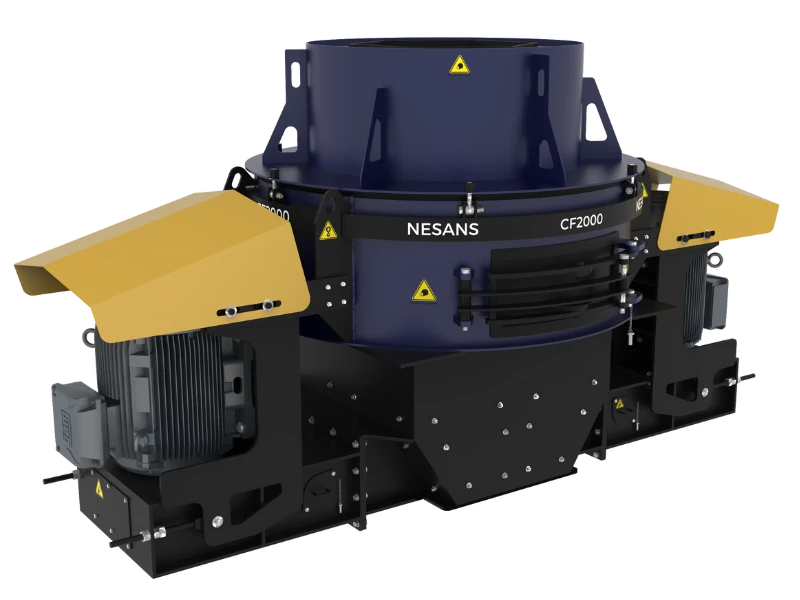
- For manufactured sand: CSS = 8-10mm (jaw/cone stage before VSI)
Step 4: Implement and Monitor
Adjust CSS in 2-3mm increments. After each adjustment, collect product samples and verify gradation before further changes. Document the relationship between CSS and product gradation for future reference.
CSS Impact on Production
| CSS Change | Throughput Impact | Product Impact | Power Impact |
|---|---|---|---|
| Tighten 5mm | -15 to -25% | Finer gradation, more fines | +10-15% |
| Open 5mm | +15 to +25% | Coarser gradation, more oversize | -10-15% |
| Optimize to target | Variable | Meet specifications efficiently | Optimal |
Quick Win #6: Implement Proper Crusher Choke Feeding
Choke feeding—maintaining a consistent material level in the crushing chamber—dramatically improves cone crusher efficiency. Many plants under-feed their cone crushers, leaving capacity unused.
Choke Feeding Benefits
- Increased throughput (15-30% improvement typical)
- Better product shape from inter-particle crushing
- More consistent gradation
- Reduced liner wear per ton processed
- Lower power consumption per ton
Implementation Steps
Step 1: Verify Crusher Can Handle Choke Feeding
Check that the crusher oil temperature stays within limits (typically < 60°C) at increased loads. Verify motor amperage capacity has headroom (should operate at 70-85% of rated for sustained choke feeding).
Step 2: Increase Feed Rate Gradually
Raise feeder speed in 5% increments while monitoring crusher behavior. Target a consistent material level visible in the feed hopper—material should be waiting to enter the crushing chamber, not the chamber waiting for material.
Step 3: Install Level Indicators
Simple visual markers on the feed hopper help operators maintain consistent levels. Paint three horizontal bands: Red (too low), Yellow (target range), Green (maximum safe level).
Step 4: Train Operators on Choke Feeding
Explain that the goal is steady, consistent feeding rather than maximum speed. Operators should watch for warning signs of over-feeding: Power spikes, unusual sounds, or material backing up in the feed system.
Quick Win #7: Fix Air Leaks and Dust Collection Inefficiencies
Dust collection systems lose 30-50% efficiency due to air leaks at joints, worn seals, and damaged ductwork. Restoring dust collection improves working conditions, reduces equipment wear, and often increases production by reducing material loss.
Air Leak Detection
Visual Method:
With the dust collection system running, release smoke (from a smoke pen or incense stick) near all duct joints, access doors, and connections. Smoke drawn into the system indicates air leaks stealing collection capacity.
Pressure Method:
Measure static pressure at the baghouse inlet and at pickup points. Excessive pressure drop between points indicates leaks or blockages in that duct section.
Common Leak Points and Fixes
| Location | Typical Issue | Quick Fix |
|---|---|---|
| Duct joints | Gaps from thermal expansion | Seal with high-temp silicone or tape |
| Access doors | Worn gaskets | Replace gaskets or add weatherstrip |
| Flexible connections | Cracked or torn hoses | Replace hose sections |
| Screen enclosures | Panel gaps | Adjust panels, add seals |
| Conveyor transfer points | Missing or damaged curtains | Replace rubber curtains |
Expected Results
Fixing air leaks typically improves dust collection efficiency by 25-40%, reduces visible dust emissions, and can recover 0.5-1.5% of production that was previously lost as airborne fines.
Quick Win #8: Streamline Startup and Shutdown Procedures
Many plants lose 15-30 minutes of productive time daily through inefficient startup and shutdown procedures. Optimizing these sequences can add an hour or more of production time per shift.
Optimized Startup Sequence
Phase 1: Pre-Start Checks (5 minutes maximum)
- Visual inspection of conveyor belts during walk-around
- Oil level and pressure verification at crushers
- Check that all guards are in place
- Verify personnel locations (safety count)
Phase 2: Equipment Start (2 minutes)
- Start dust collection system
- Start all conveyors simultaneously (working from discharge back to feed)
- Start screens
- Start secondary/tertiary crushers
- Start primary crusher
- Start feeder at reduced speed
Phase 3: Production Ramp-Up (3 minutes)
- Gradually increase feeder speed to operating rate
- Verify all equipment running normally
- Confirm material flow through the system
Common Startup Time Wasters
| Time Waster | Time Lost | Solution |
|---|---|---|
| Sequential conveyor starts | 5-8 minutes | Start all conveyors simultaneously |
| Extended warm-up at idle | 10-15 minutes | Start feeding within 2 minutes if oil is warm |
| Equipment-by-equipment checks | 15-20 minutes | Do visual checks during single walk-around |
| Waiting for full system before feeding | 5-10 minutes | Start feeding as soon as conveyors run |
Quick Win #9: Reduce Unplanned Stoppages with Basic Monitoring
Simple monitoring practices catch developing problems before they cause unplanned shutdowns. Most monitoring requires no capital investment—just systematic observation.
Daily Monitoring Checklist
| Equipment | What to Monitor | Warning Sign | Action Required |
|---|---|---|---|
| Crushers | Oil temperature | >55°C | Check oil level, cooler function |
| Crushers | Operating amperage | Fluctuation >20% | Check feed consistency |
| Conveyors | Motor temperature | Hot to touch | Check alignment, loading |
| Screens | Vibration amplitude | Uneven or reduced | Check springs, bearings |
| Vibrators | Bearing noise | Grinding or squealing | Schedule bearing replacement |
| Drives | Belt tension/alignment | Slipping or squealing | Adjust tension |
Weekly Monitoring Tasks
- Check crusher liner thickness at 4 points per jaw/mantle
- Verify screen media tension and condition
- Inspect conveyor belt edges and splices
- Check dust collector pressure drop
- Review electrical panel for tripped breakers or warning lights
Impact of Systematic Monitoring
Plants implementing basic daily monitoring typically reduce unplanned stoppages by 40-60%. Each prevented stoppage saves 30-90 minutes of production time plus associated restart inefficiencies.
Quick Win #10: Eliminate Production Recording Errors
Accurate production recording seems administrative, but it directly impacts optimization efforts. If you don't know your true production, you can't measure improvements.
Common Recording Errors
| Error Type | Impact | Correction |
|---|---|---|
| Inconsistent truck counting | ±5-15% production uncertainty | Standardize counting procedures |
| Estimated truck loads | ±10-20% tonnage uncertainty | Periodic weighbridge calibration |
| Not recording downtime | Can't identify loss sources | Log all stoppages >5 minutes |
| Delayed recording | Memory errors compound | Real-time recording requirement |
Simple Production Tracking System
Implement a basic shift log capturing:
- Start time and end time of production
- Total truck loads by product type
- All stoppages >5 minutes with cause
- Any equipment issues observed
- Material quality observations
Review logs weekly to identify patterns. Common findings include:
- Specific times of day with lower production (investigate causes)
- Recurring stoppages from the same equipment (schedule maintenance)
- Variation between shifts (standardize procedures)
Implementation Priority Matrix
Not all quick wins deliver equal value. Prioritize based on your plant's specific situation:
| Quick Win | Implementation Time | Expected Impact | Priority (1-10) |
|---|---|---|---|
| #1: Feed distribution | 2-4 hours | +15-25% throughput | 10 (highest) |
| #6: Choke feeding | 1-2 hours | +15-30% throughput | 9 |
| #2: Feeder calibration | 2-3 hours | +10-20% throughput | 8 |
| #5: CSS optimization | 2-4 hours | +10-15% throughput | 8 |
| #3: Screen adjustment | 2-3 hours | +10-25% efficiency | 7 |
| #8: Startup procedures | 1 hour (training) | +30-60 min/shift | 7 |
| #4: Belt tracking | 1-2 hours | Reduced spillage/stops | 6 |
| #9: Basic monitoring | Ongoing | -40-60% unplanned stops | 6 |
| #7: Dust collection | 2-4 hours | +0.5-1.5% material recovery | 5 |
| #10: Production recording | Ongoing | Enables other improvements | 5 |
Measuring Success: Before and After Tracking
To demonstrate value from quick wins, establish baseline measurements before implementing changes:
Key Performance Indicators
- Hourly tonnage: Track total production divided by operating hours
- Operating hours per shift: Total shift time minus all stoppages
- Power consumption per ton: kWh meter reading divided by tonnage
- Product quality compliance: Percentage of samples meeting specifications
- Unplanned stoppages: Count and duration of unexpected shutdowns
Tracking Template
| Metric | Week Before | Week 1 | Week 2 | Week 3 | Week 4 |
|---|---|---|---|---|---|
| Daily production (tons) | |||||
| Operating hours | |||||
| Tons per operating hour | |||||
| kWh per ton | |||||
| Unplanned stoppages (count) | |||||
| Stoppage duration (minutes) |
Sustaining Improvements
Quick wins deliver immediate results, but sustaining those gains requires ongoing attention:
Daily Practices
- Brief shift-start meeting to review yesterday's production and today's focus
- Operator walk-around with monitoring checklist
- Production recording at regular intervals
Weekly Reviews
- Compare production metrics to baseline and targets
- Review stoppage log for patterns
- Identify equipment requiring attention
Monthly Analysis
- Calculate month-over-month production trends
- Assess wear part consumption and costs
- Plan preventive maintenance for the coming month
Real-World Results from Indian Crushing Operations
Implementation results from crushing plants that applied these quick wins systematically:
Case Study: 150 TPH Aggregate Plant, Tamil Nadu
Implemented Quick Wins #1, #2, #3, and #6 over two weeks.
- Production increased from 1,050 to 1,380 tons/day (+31%)
- Power consumption dropped from 3.1 to 2.6 kWh/ton (-16%)
- Jaw plate life extended from 8 weeks to 11 weeks (+38%)
Case Study: 200 TPH M-Sand Plant, Karnataka
Implemented Quick Wins #5, #6, #8, and #9 over three weeks.
- Operating hours increased from 14 to 17 hours/day (+21%)
- Unplanned stoppages reduced from 8 to 3 per week (-63%)
- Daily production increased from 2,400 to 3,060 tons (+28%)
Conclusion: Start Today, See Results Tomorrow
These 10 quick wins represent proven optimization strategies that require minimal investment but deliver substantial returns. The key is systematic implementation—pick the highest-priority items for your operation, implement them properly, measure the results, and move to the next opportunity.
Most plants find that implementing just 3-4 of these quick wins improves production by 20-30% within a month. That improvement compounds over time as better practices become habitual and your team develops an optimization mindset.
The best time to start is now. Pick one quick win, implement it today, and measure the results. You'll likely find the improvement so compelling that you'll be eager to implement the rest.