


Your crusher generates 18-25% fines (material passing 4.75mm) that you're currently stockpiling as waste or selling at ₹200/ton for road sub-base. Meanwhile, manufactured sand (M-Sand) from these same fines commands ₹800-1,200/ton in ready-mix concrete markets—a ₹600-1,000/ton value gap. The difference isn't the material; it's the processing. Proper washing, grading correction, and quality control transform crusher dust from a disposal problem into your plant's highest-margin product, adding ₹500-800/ton revenue while eliminating waste handling costs.
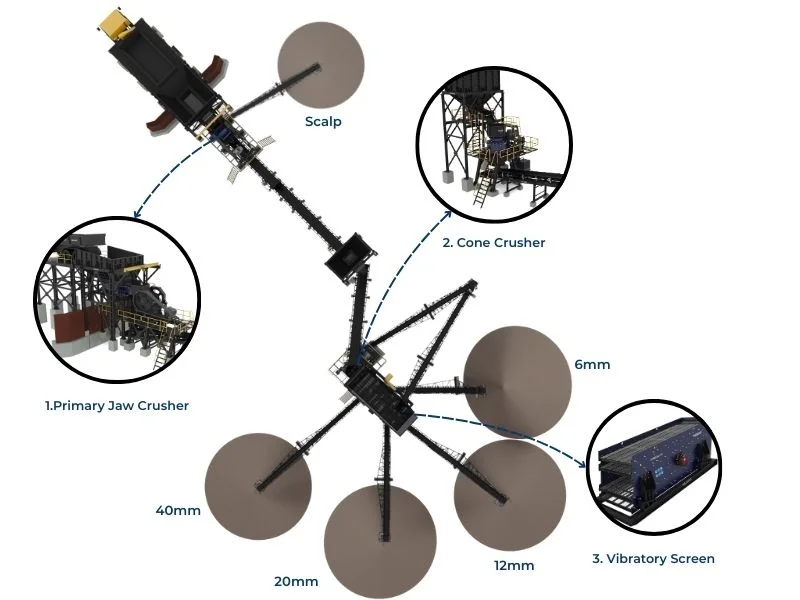
Aggregate crushing operations inherently produce significant fines fractions. In a typical jaw-cone crushing circuit processing hard rock, 22-28% of output falls below 4.75mm, with 12-15% passing 150 microns. Traditionally treated as waste, these fines represent untapped revenue potential. With river sand mining restrictions tightening across India and M-Sand adoption reaching 65-70% in urban construction markets, crusher dust monetization has shifted from optional to essential for competitive crushing operations.
This guide examines the engineering systems and quality control processes required to transform crusher fines into specification-grade manufactured sand, focusing on washing technology, gradation optimization, and market positioning strategies that generate ₹500/ton or higher revenue from material currently treated as waste.
Understanding Crusher Dust Composition and Value Potential
Material Characteristics and Quality Issues
Crusher dust differs fundamentally from natural river sand in ways that affect both processing requirements and end-use performance:
Particle Shape and Texture:
- Angular particles with high surface area (1.2-1.8x river sand) improve concrete bonding
- Rough texture increases water demand by 8-12% but enhances mechanical interlock
- Flaky and elongated particles (>15% in poor crushing circuits) reduce workability
- Cubical particles from modern VSI crushers achieve shape characteristics superior to river sand
Clay and Silt Content:
- Quarry dust typically contains 8-18% material passing 75 microns vs. 3-5% limit in IS 383
- Clay coatings on particles (from weathered rock or overburden contamination) reduce cement bond
- Excessive fines increase water demand, reduce strength, and cause segregation in concrete
- Washing reduces minus 75-micron content to 3-7%, meeting concrete sand specifications
Gradation Deficiencies:
- Raw crusher dust typically shows gap grading with excess fines and deficiency in 600µm-2.36mm range
- Zone IV grading (very fine) common in secondary crusher discharge requires coarse fraction blending
- Proper screening and blending can shift material to Zone II or III (optimal for concrete)
⚠️ Economic Impact: A 200 TPH crushing plant producing 25% fines (50 TPH) generates 10,000-12,000 tons of crusher dust monthly. At current disposal/low-value pricing (₹200/ton), this represents ₹20-24 lakhs monthly revenue. Processed into specification M-Sand at ₹900/ton average, the same material generates ₹90 lakhs-1.08 crores monthly—a ₹70-84 lakhs monthly incremental revenue. After processing costs of ₹250-300/ton, net additional margin reaches ₹500-650/ton or ₹50-65 lakhs monthly.
Washing System Design for Fines Recovery
Technology Selection and Configuration
Effective crusher dust processing requires washing systems optimized for fine material rather than coarse aggregate. Key equipment differences include:
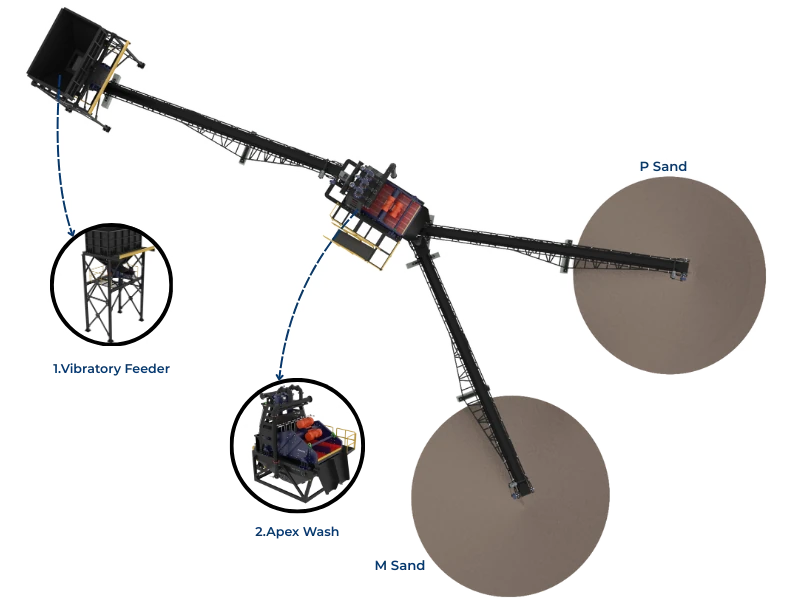
Log Washer vs. Screw Washer Selection:
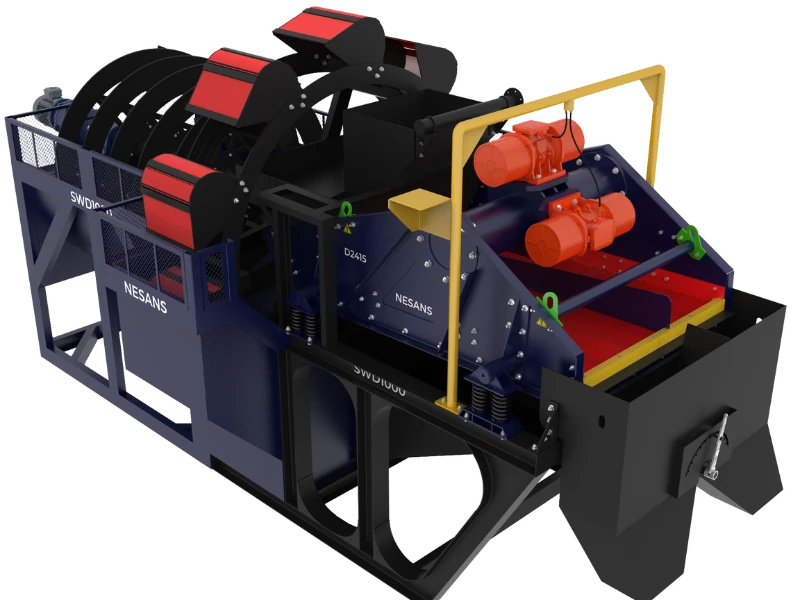
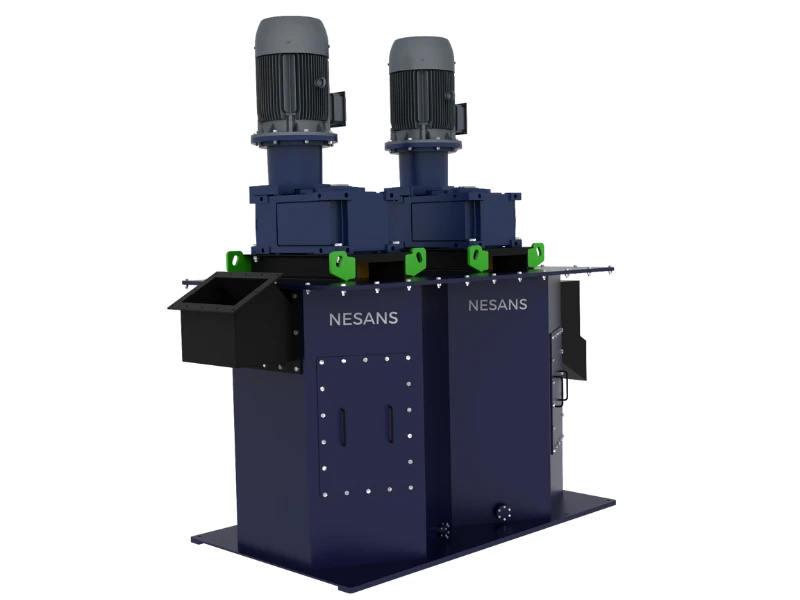
Log Washers (Preferred for Clay-Heavy Material):
- Twin-shaft design with intermeshing paddles provides aggressive scrubbing action
- Effective for material with 10-20% clay content requiring particle surface cleaning
- Capacity: 30-80 TPH per unit depending on contamination level
- Water consumption: 1.2-1.8 m³/ton processed
- Power requirement: 0.8-1.2 kW/ton
- Capital cost: ₹25-40 lakhs for 50 TPH unit
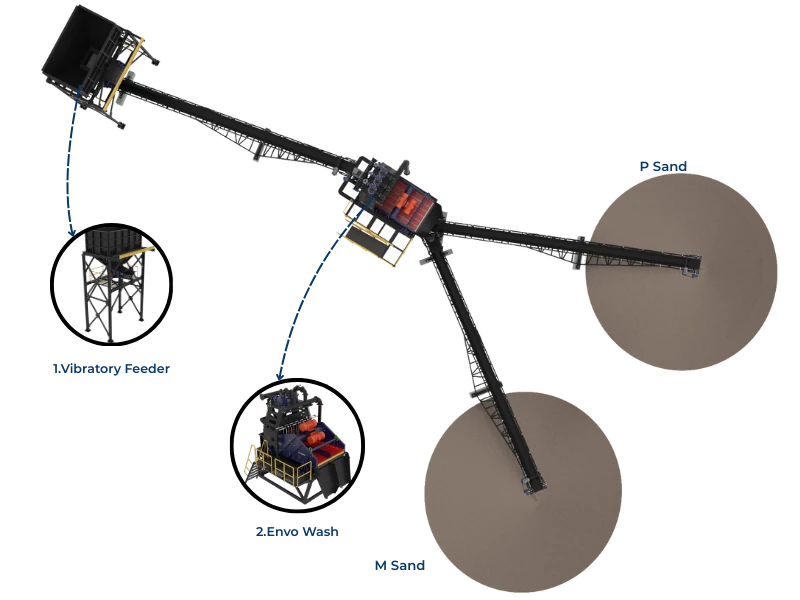
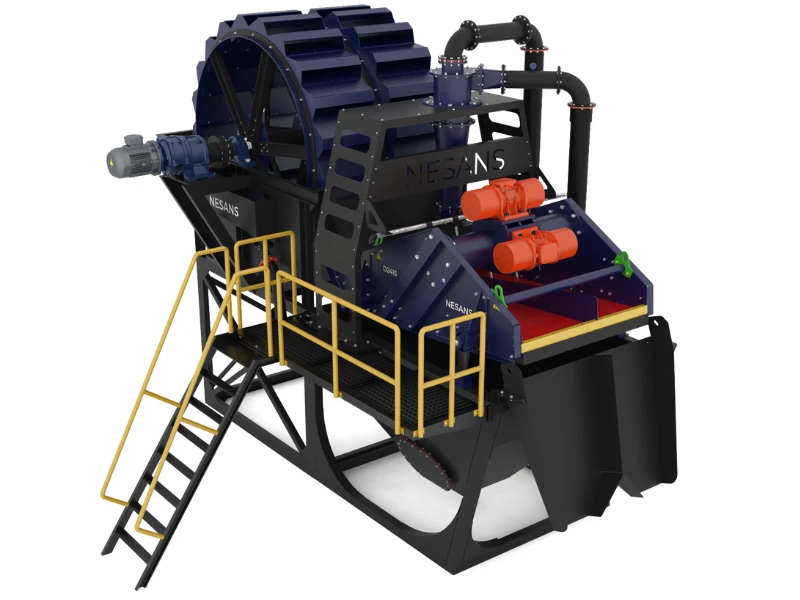
Screw Washers (For Lower Clay Content):
- Inclined screw conveys material upward while water flows counter-current
- Suitable for material with 5-10% fines requiring size classification more than scrubbing
- Capacity: 40-120 TPH depending on slope angle (18-22° typical)
- Water consumption: 0.8-1.2 m³/ton
- Power requirement: 0.5-0.8 kW/ton
- Capital cost: ₹18-30 lakhs for 50 TPH unit
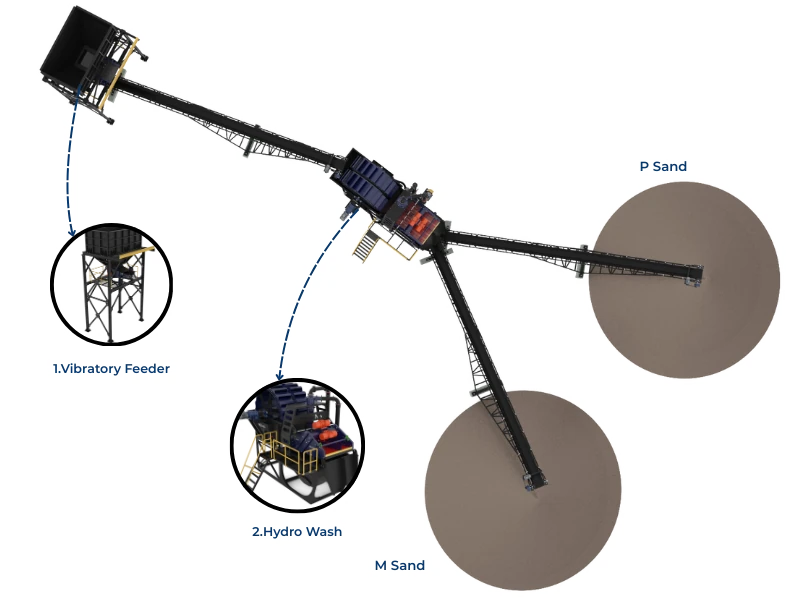
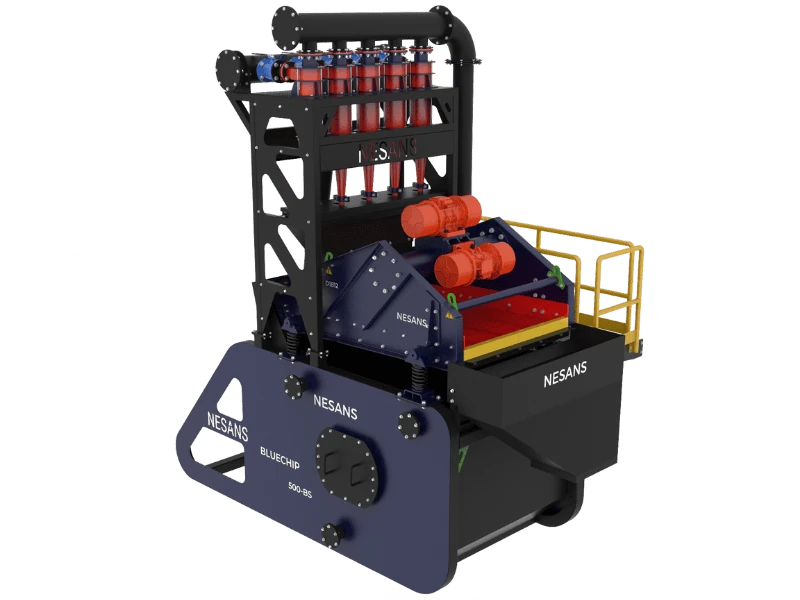
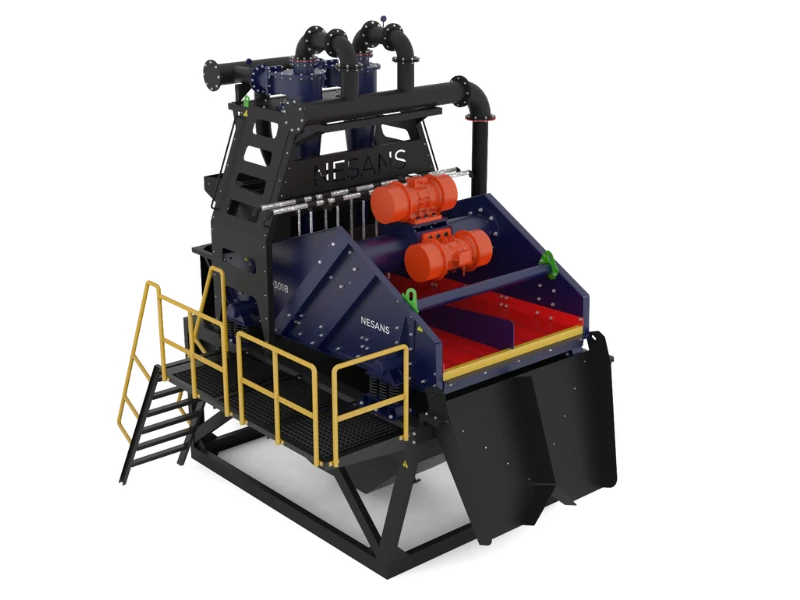
Hydrocyclone Classification:
- Essential for removing minus 75-micron material while recovering 150µm-4.75mm fraction
- Typical configuration: 250-350mm diameter cyclones in parallel banks
- Cut point: 60-80 microns depending on feed density and pressure
- Feed pressure: 0.8-1.2 bar (requires centrifugal pump 15-25 HP)
- Underflow (product): 65-75% solids, overflow (waste): 3-8% solids
- Recovery efficiency: 88-94% of plus 75-micron material to product
Dewatering Screens:
- High-frequency screens (1800-2400 RPM) with polyurethane panels for fine material drainage
- Deck slope: 18-25° to balance drainage with material conveyance
- Spray water: 0.1-0.2 m³/ton for final rinsing of product
- Discharge moisture: 8-14% depending on particle size distribution
Water Circuit Design and Clarification
Closed-loop water systems are essential for cost control and environmental compliance. A properly designed circuit achieves:
- Fresh Water Consumption: 0.15-0.25 m³/ton (vs. 1.5-2.5 m³/ton in open systems)
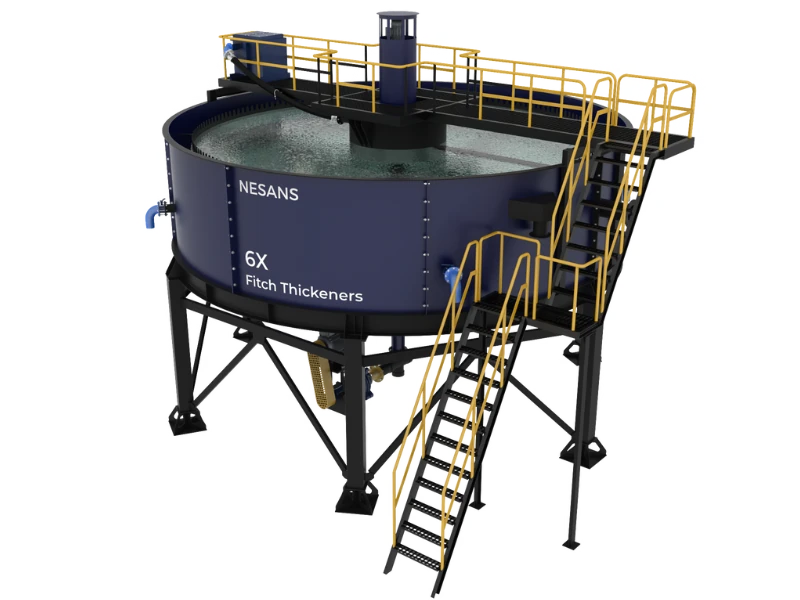
- Clarifier Design: 20-30 minute retention time for gravity settling of 75µm+ particles
- Flocculant Dosing: 15-25 grams/ton anionic polymer for sub-75µm particle agglomeration
- Overflow Clarity: <500 ppm suspended solids enables water reuse without screen blinding
- Thickener Underflow: 45-55% solids pumped to filter press for final dewatering
💰 Water System Economics: For 50 TPH fines processing (10 hours/day operation), fresh water consumption drops from 750-1,250 m³/day (open system) to 75-125 m³/day (closed loop). At ₹15/m³ water cost plus ₹8/m³ disposal fee, this saves ₹15,525-25,875 daily or ₹4.65-7.76 lakhs monthly. Closed-loop system capital cost of ₹35-55 lakhs achieves payback in 5-8 months from water savings alone, before considering M-Sand revenue.
Gradation Correction and Blending Systems
Understanding Target Gradation Zones
IS 383:2016 defines four gradation zones for fine aggregate, with different suitability for concrete applications:
Zone II (Preferred for Most Applications):
- Fineness modulus: 2.6-2.9
- Passing 600µm sieve: 60-75%
- Passing 150µm sieve: 15-30%
- Optimal balance of workability and strength for M20-M40 concrete
- Commands premium pricing (₹950-1,200/ton in metro markets)
Zone III (Acceptable for General Concrete):
- Fineness modulus: 2.2-2.6
- Higher fines content (20-35% passing 150µm before washing)
- After washing: Achieves 5-8% passing 75µm, suitable for M15-M30 concrete
- Market price: ₹800-950/ton
Blending Strategies for Gradation Control
Raw crusher dust rarely matches target gradations without correction. Common blending approaches:
Coarse Fraction Addition:
- Blend 20-35% of 2.36-4.75mm material from primary screen oversize
- Shifts gap-graded fines into Zone II or III range
- Requires separate stockpiling and controlled proportioning (belt scales or volumetric feeders)
- Increases fineness modulus by 0.3-0.6 points
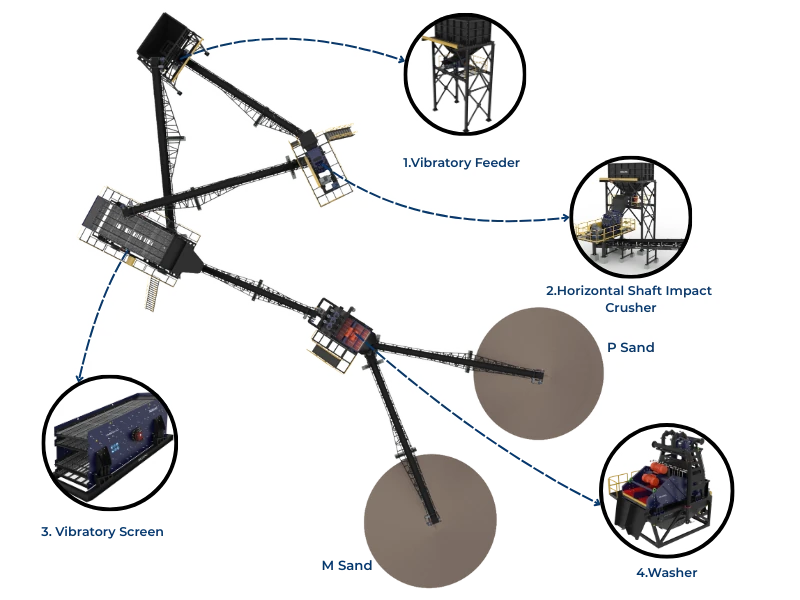
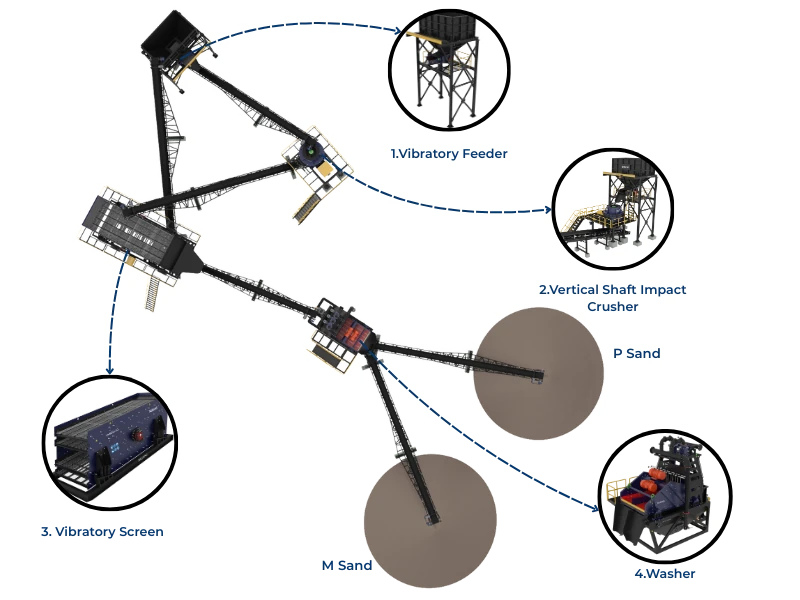
VSI Crusher Reshaping:
- Pass washed fines through VSI crusher at 60-80 m/s tip speed
- Improves particle shape (cubicity increases from 15-25% to 35-50%)
- Generates additional 8-12% fines requiring secondary washing (recycle to log washer)
- Power cost: ₹35-50/ton, offset by ₹100-150/ton premium for superior shape
Multi-Grade Production:
- Process fines into 2-3 gradation products (coarse M-Sand, medium M-Sand, plaster sand)
- Requires additional screening (typically 2.36mm and 1.18mm decks)
- Maximizes revenue by matching material characteristics to optimal applications
- Coarse M-Sand (Zone II): ₹1,000-1,200/ton for structural concrete
- Fine M-Sand (Zone III): ₹850-1,000/ton for masonry and plaster
Quality Control and Market Positioning
Testing Requirements and Specification Compliance
M-Sand market acceptance requires consistent quality demonstration through regular testing:
Essential Daily Tests:
- Sieve Analysis: Every 2 hours (500g sample) to verify gradation stability
- Moisture Content: Every load for batch plant delivery (affects concrete mix proportioning)
- Visual Inspection: Color consistency, absence of clay lumps, minimal dust generation
Weekly Laboratory Tests:
- Silt Content (Field Test): Target <8%, absolute maximum 10% per IS 383
- Specific Gravity: 2.6-2.7 for most rock types (affects concrete density calculations)
- Water Absorption: Target <2%, maximum 3% (indicates porosity and weathering)
- Soundness (Na₂SO₄): <10% loss after 5 cycles (durability indicator)
Monthly Certification Tests:
- Clay Lumps and Friable Particles: <3% by weight per IS 2386 Part II
- Organic Impurities: Colorimetric test (solution lighter than standard color)
- Chlorides and Sulfates: <0.05% and <0.5% respectively for RCC applications
- Alkali-Aggregate Reactivity: For premium structural applications (mortar bar expansion <0.1% at 6 months)
Market Development Strategy
Target Customer Segments:
Ready-Mix Concrete Plants (Highest Volume, Best Margins):
- Require 200-500 tons daily per plant with consistent gradation ±3% tolerance
- Demand 6-month quality track record before specification approval
- Payment terms: 30-45 days but premium pricing (₹950-1,200/ton)
- Logistics: Direct truck delivery or conveyor if plant <5 km from quarry
Precast Concrete Manufacturers:
- Moderate volume (50-150 TPD) but require superior particle shape (cubicity >40%)
- Willing to pay ₹100-150/ton premium for VSI-processed material
- Strict quality compliance (reject loads failing gradation or silt tests)
Block and Paver Manufacturers:
- Price-sensitive segment (₹800-900/ton) but accept Zone III gradation
- Volume: 30-100 TPD per customer
- Less stringent testing requirements (weekly sieve analysis acceptable)
Retail Bagging for Small Construction:
- Highest unit price (₹1,200-1,500/ton in 50kg bags) but significant handling cost
- Requires bagging plant (₹8-12 lakhs investment), storage shed, retail distribution
- Suitable for plants near urban areas with limited RMC plant access
Implementation Economics and ROI Calculation
Capital Investment Breakdown
For a 50 TPH (500 tons/day @ 10 hours operation) fines processing system:
Core Processing Equipment:
- Log washer or screw washer (50 TPH capacity): ₹25-35 lakhs
- Hydrocyclone bank (4x 300mm units with feed pump): ₹18-25 lakhs
- Dewatering screen (high-frequency 1.5x4.5m): ₹12-18 lakhs
- VSI crusher for shape correction (optional): ₹45-65 lakhs
Water Circuit:
- Clarifier tank (80-100 m³ capacity): ₹15-22 lakhs
- Thickener and filter press (25-35 m³/hr): ₹28-40 lakhs
- Pumps and piping: ₹8-12 lakhs
- Flocculant dosing system: ₹3-5 lakhs
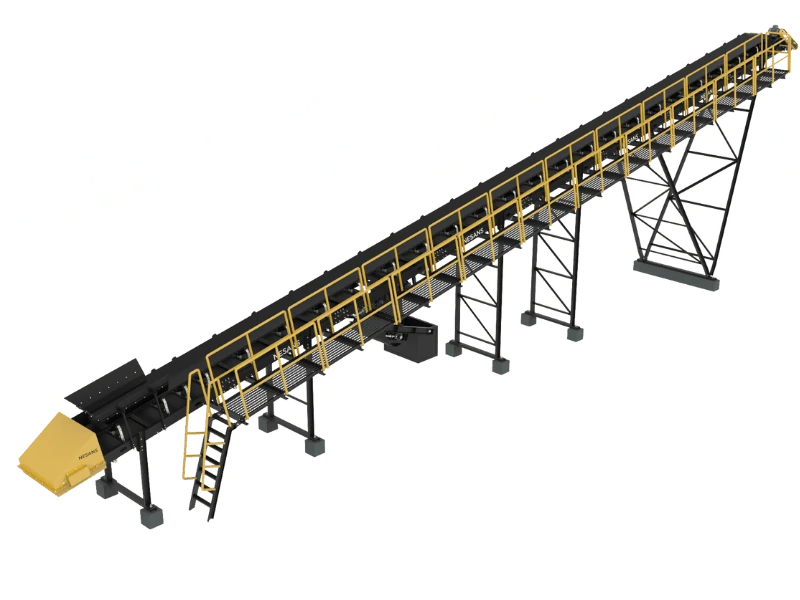
Material Handling:
- Conveyors and hoppers: ₹15-20 lakhs
- Stockpile area (paved, 2000-3000 ton capacity): ₹12-18 lakhs
- Loader for reclaim: ₹25-35 lakhs (if not existing)
Total Investment Range: ₹1.6-2.5 crores without VSI, ₹2.0-3.1 crores with VSI shape correction
Operating Cost Analysis
Per Ton Operating Costs (50 TPH System):
- Power: 12-15 kWh/ton @ ₹6.5/kWh = ₹78-98/ton
- Water: 0.2 m³/ton @ ₹15/m³ = ₹3/ton (closed loop)
- Flocculant: 20g/ton @ ₹180/kg = ₹3.6/ton
- Wear Parts: Screen panels, cyclone liners, pump impellers = ₹25-35/ton
- Labor: 4 operators per shift @ ₹600/shift = ₹48/ton (50 TPH rate)
- Maintenance: 3% of capital annually = ₹15-20/ton
Total Operating Cost: ₹172-207/ton
Revenue Model and Payback
Baseline Scenario (Conservative Pricing):
- Production: 50 TPH x 10 hours x 26 days = 13,000 tons/month
- Revenue: ₹900/ton average selling price = ₹1.17 crores/month
- Operating Costs: ₹190/ton average = ₹24.7 lakhs/month
- Gross Margin: ₹710/ton or ₹92.3 lakhs/month
- Previous Fines Revenue: ₹200/ton = ₹26 lakhs/month
- Incremental Margin: ₹66.3 lakhs/month
Payback Period: ₹2.2 crores investment / ₹66.3 lakhs monthly margin = 3.3 months
Premium Scenario (RMC Supply with VSI Processing):
- Revenue: ₹1,100/ton = ₹1.43 crores/month
- Operating Costs: ₹240/ton (including VSI) = ₹31.2 lakhs/month
- Gross Margin: ₹860/ton or ₹1.118 crores/month
- Incremental Margin: ₹85.8 lakhs/month
- Payback Period: ₹2.8 crores / ₹85.8 lakhs = 3.3 months
Implementation Roadmap
Phase 1: Assessment and Planning (Weeks 1-3)
- Material Characterization: Submit 50kg samples to testing lab for complete analysis (gradation, clay content, deleterious materials)
- Market Survey: Contact 5-8 RMC plants within 50km radius to assess demand and pricing
- Site Layout: Designate 0.4-0.6 hectare area adjacent to crushing plant for processing equipment and stockpiles
- Regulatory: Verify environmental clearance covers fines processing and water recycling (obtain amendment if needed)
Phase 2: Procurement and Installation (Weeks 4-12)
- Equipment Selection: Choose supplier based on 3-year operating cost analysis, not just capital cost
- Civil Works: Construct equipment foundations, clarifier, and paved stockpile area (4-6 weeks)
- Installation: Equipment erection, piping, electrical (3-4 weeks)
- Commissioning: System testing, water circuit balancing, operator training (1-2 weeks)
Phase 3: Quality Validation (Weeks 13-18)
- Process Optimization: Adjust cyclone pressure, flocculant dosing, blending ratios to achieve target gradation
- Testing Program: Generate 6-week quality data (daily sieve analysis, weekly absorption/soundness tests)
- Sample Submission: Provide 5-ton trial quantities to potential RMC customers for concrete trials
- Certification: Obtain third-party testing certification (BIS lab preferred) for marketing credibility
Phase 4: Market Entry (Weeks 19-26)
- Customer Qualification: Focus on 2-3 anchor RMC customers for initial 70% of production volume
- Logistics Setup: Establish truck scheduling system for consistent delivery (critical for RMC plant approval)
- Quality Documentation: Implement daily test report system with automatic customer transmission
- Gradual Ramp-Up: Start at 60-70% capacity for first 2 months, increase to 90%+ as market confidence builds
Risk Factors and Mitigation
Technical Risks
Excessive Clay Content (>15%):
- Symptom: Log washer unable to achieve <8% silt content in final product
- Solution: Install attrition mill ahead of washer for aggressive clay disaggregation (₹15-22 lakhs additional investment)
- Alternative: Blend with cleaner fines from different crushing stage or reject high-clay material to alternative uses
Water Scarcity or High Cost:
- Impact: Fresh water cost >₹25/m³ significantly increases operating costs
- Solution: Invest in enhanced clarification (larger thickener, higher polymer dosing) to achieve >95% water recovery
- ROI: Additional ₹8-12 lakhs investment saves ₹2-3 lakhs/month in water cost
Market Risks
RMC Plant Quality Rejection:
- Cause: Gradation variation exceeding ±5% between loads
- Prevention: Install automatic sampler and rapid sieve analysis system (₹4-6 lakhs) for real-time quality monitoring
- Contract Terms: Negotiate 8-10% tolerance for first 3 months during process stabilization
Price Competition from Illegal River Sand:
- Risk: Unregulated river sand at ₹600-700/ton undercuts M-Sand pricing
- Response: Focus on quality differentiation (consistent gradation, certified testing) and supply reliability
- Target: Premium customers (RMC plants with ISO certification, government projects) less likely to use illegal material
Performance Monitoring and Optimization
Key Performance Indicators
Track these metrics weekly to ensure system performance and profitability:
- Recovery Rate: Saleable M-Sand tons / crusher fines input tons (target: 82-88%)
- Specific Power Consumption: kWh per ton M-Sand produced (target: <15 kWh/ton)
- Water Consumption: Fresh water m³ per ton (target: <0.25 m³/ton in closed loop)
- Gradation Consistency: Standard deviation of fineness modulus (target: <0.15)
- Quality Rejection Rate: Rejected loads / total deliveries (target: <2%)
- Weighted Average Selling Price: Total revenue / tons sold (track monthly trend)
- Contribution Margin: (Revenue - variable costs) / Revenue (target: >75%)
Continuous Improvement Opportunities
After 6-12 Months Stable Operation:
- Automation: Install PLC control for cyclone feed density and flocculant dosing (₹8-12 lakhs investment, reduces labor 30-40%)
- Energy Optimization: Variable frequency drives on pumps and conveyors (5-8% power reduction, 18-24 month payback)
- Product Diversification: Add plaster sand (fine grade) and coarse M-Sand products to capture niche markets
- Geographic Expansion: Establish satellite stockpiles in high-demand areas 50-100km from plant to capture higher pricing zones
✓ Success Metrics: Well-executed crusher dust monetization projects achieve: (1) <4 month payback on capital investment, (2) ₹500-800/ton incremental margin vs. fines disposal, (3) 85-90% system availability after 6-month stabilization, (4) >95% customer retention in RMC segment, and (5) 15-25% increase in overall plant profitability through fines revenue contribution.